In today’s digital learning environment, data is more than just numbers—it’s the key to understanding how your courses perform and how your learners engage with content.
When managing an online learning initiative, LMS analytics can provide critical insights that help you and your team track learner progress, identify trends, and make data-driven decisions to enhance learning outcomes.
But basic LMS reporting only scratches the surface. Advanced analytics, as part of your LMS’s reporting capabilities, allows you to dive deeper—offering custom dashboards, real-time tracking, and automated reporting that help your business optimize training programs with precision.
In this blog post, you’ll explore:
- What Are LMS Analytics?
- Key Metrics in LMS Analytics
- How LMS Analytics Improve Learning Outcomes
- Using Thinkific Plus’s Advanced Analytics
- Choosing The Right LMS For Your Business
- Tips for Implementing LMS Analytics Effectively
- Future Trends in LMS Analytics
Click above to skip ahead.
By the end of this post, you and your team will have a clear understanding of how to leverage LMS analytics to drive better results—whether that means improving engagement, increasing course completion rates, or proving the ROI of your learning programs.
What Are LMS Analytics?
LMS analytics refer to the data and insights generated by your Learning Management System (LMS) that help you and your team track learner progress, measure engagement, and evaluate the effectiveness of your courses. These insights go beyond just completion rates—they provide a comprehensive view of how learners interact with your training programs and where improvements can be made.
With advanced analytics as part of your LMS’s reporting capabilities, you can move beyond surface-level metrics to gain real-time insights, automate reporting, and segment learners based on performance trends. This allows you and your business to make strategic decisions that enhance learning experiences and maximize training ROI.
Definition of LMS Analytics
At its core, LMS analytics is the process of collecting, analyzing, and interpreting data from your learning platform to assess learner engagement, knowledge retention, and training effectiveness.
Traditional LMS reporting focuses on basic metrics like course enrollments, completions, and quiz scores. While these are valuable, they don’t provide the full picture. Advanced analytics enhances this by allowing you to track detailed learner behaviors, customize reports for different stakeholders, and automate data collection for ongoing insights.
Importance in Modern Learning
In today’s data-driven world, simply offering online courses isn’t enough—you need to understand how well your training programs perform and how they impact your business goals. LMS analytics empower you and your team to:
- Optimize course content: Identify which lessons are most engaging and where learners struggle.
- Improve learner retention: Spot early signs of disengagement and take action before learners drop off.
- Measure the business impact of training: Connect learning initiatives to key performance indicators (KPIs) such as employee productivity, customer adoption, or compliance rates.
- Make informed, data-driven decisions: Move away from guesswork and ensure your training programs are constantly improving based on real insights.
With an LMS like Thinkific Plus that includes advanced analytics, you can transform your training data into meaningful, actionable strategies that drive real learning success.
Examples of LMS Analytics Tools
LMS platforms provide different levels of analytics, ranging from basic progress tracking to advanced reporting with AI-driven insights. The right analytics tools can help organizations measure training effectiveness, optimize learner engagement, and streamline reporting.
Here are some common types of LMS analytics tools and their key functions:
- Custom LMS dashboards – Display real-time learning data, including enrollments, course progress, and learner activity. These dashboards can be tailored to track specific business or training goals.
- Engagement tracking tools – Monitor how learners interact with course materials, discussion forums, and multimedia content to assess engagement levels.
- Video analytics – Provide insights into learner behavior with video content, including play rates, watch times, and drop-off points.
- Automated reporting systems – Generate scheduled reports and send insights directly to key stakeholders without manual intervention.
- Predictive analytics – Use historical learner data to forecast trends, identify at-risk students, and recommend personalized learning paths.
- Integration with business intelligence tools – Some LMS platforms allow integration with external BI tools like Power BI, Google Data Studio, or Tableau for deeper data analysis.
Choosing the Right LMS Analytics Tools
Selecting the best analytics tools for your organization depends on:
- Your reporting needs – Do you need real-time tracking, predictive analytics, or simple completion reports?
- Automation capabilities – Would automated report scheduling and alerts improve your workflow?
- Customization options – Do you need dashboards that allow you to filter and display specific metrics?
- Integration requirements – Will your LMS analytics need to sync with HR, CRM, or other business intelligence tools?
By leveraging the right LMS analytics tools, organizations can move beyond surface-level tracking and gain actionable insights to improve training effectiveness and business outcomes.
Key Metrics In LMS Analytics
LMS analytics help you and your team track learner engagement, course effectiveness, and knowledge retention, enabling you to make data-driven improvements to your learning programs. By analyzing the right metrics, you can identify patterns in student behavior, measure the impact of your courses, and optimize training for better outcomes.
While standard LMS reporting provides basic insights like completion rates and quiz scores, advanced analytics allow you to dive deeper, offering custom dashboards, real-time tracking, and automated reporting. These capabilities make it easier to spot trends, predict learning outcomes, and enhance the overall learning experience.
Below are the most important metrics that help you evaluate course effectiveness, learner engagement, and knowledge retention.
Learner Engagement Metrics
Understanding how learners interact with your courses is key to improving engagement and retention. Instead of just tracking course completions, LMS analytics allow you to measure how actively students participate in lessons and learning communities.
| Metric | What It Measures | Why It Matters |
| Engagement Trends | Tracks the unique number of students interacting with a course or community over a chosen timeframe. | Helps you identify participation trends and drop-off points. |
| Engagement by Product | Measures which courses or communities have the highest number of active students. | Helps determine which content is most engaging and effective. |
| Engagement by Student | Ranks students based on how many days they engage with courses or communities. | Identifies top learners and those at risk of disengagement. |
| Active Enrollments | Tracks the number of students who had access to courses or communities during a given period. | Helps monitor learner retention and participation trends over time. |
With an LMS like Thinkific Plus that has advanced analytics, you can segment engagement data by time-frame, automate reporting, and track real-time trends to enhance the learning experience.
Course Completion Rates
While course completion rates are a common metric, tracking how learners progress through a course can also offer deeper insights into their learning journey.
| Metric | What It Measures | Why It Matters |
| Course Completion Rates | The percentage of students who complete a course compared to those who enroll. | Helps evaluate course effectiveness and learner motivation. |
| Module Completion Tracking | Tracks how far learners progress within a course. | Pinpoints areas where learners struggle or disengage. |
| Time to Completion | Measures how long it takes students to finish a course. | Helps optimize pacing and identify barriers to completion. |
| Individual Progress Reports | Provides an overview of a learner’s course activity, including start date, last login, and progress percentage. | Helps measure learner success and identify those needing support. |
With Thinkific Plus’s advanced analytics, you can automate progress tracking, generate real-time reports, and segment learners by performance to provide personalized support.
Knowledge Retention Indicators
Knowing whether learners complete a course is one thing—but are they actually retaining what they learn? LMS analytics help assess knowledge retention and learning effectiveness through quizzes, assessments, and feedback surveys.
| Metric | What It Measures | Why It Matters |
| Assessment Scores Over Time | Tracks learner performance in quizzes and exams before, during, and after a course. | Helps measure knowledge retention and learning progress. |
| Follow-Up Assessments | Post-course quizzes or refresher tests. | Evaluates how well learners retain information long-term. |
| Survey Feedback on Comprehension | Captures learner feedback on how well they understand and apply course material. | Helps assess course clarity and effectiveness. |
By using advanced analytics, you can set up automated quiz reporting, analyze assessment trends, and use data-driven insights to refine your training content.
Why These Metrics Matter
Tracking the right LMS analytics enables you and your team to:
- Identify content strengths and weaknesses to improve engagement.
- Personalize learning experiences based on learner behavior.
- Measure training effectiveness with deeper insights into performance and retention.
With Thinkific Plus’s advanced analytics, you can create custom dashboards, automate reporting, and gain real-time insights to refine your learning strategy.
How LMS Analytics Improve Learning Outcomes
LMS analytics are more than just numbers—they provide actionable insights that help you and your team refine learning experiences, enhance engagement, and measure success.
By leveraging both basic reporting and advanced analytics, you can move beyond tracking participation to understanding how learners interact with content, where they struggle, and how to improve knowledge retention.
Below are three key ways LMS analytics drive better learning outcomes:
1. Personalized Learning Paths
Without analytics, personalizing training experiences can be challenging. LMS analytics allow you to understand how learners engage with content, track their progress, and tailor learning paths to their needs.
Here are some tips to get started:
- Track learner behavior to see where students are excelling or struggling. This helps you determine whether they need additional support or more advanced materials.
- Provide adaptive learning recommendations by identifying trends in quiz performance and engagement levels, ensuring learners receive targeted resources.
- Adjust course pacing dynamically based on real-time progress tracking, making it easier to keep students engaged and motivated.
With advanced analytics, you can segment learners based on engagement levels, automate progress tracking, and craft customized learning paths that help every learner succeed.
2. Data-Driven Decision Making
LMS analytics provide real-time, data-backed insights that support both learning strategy improvements and high-level business decisions. By analyzing learner behavior, engagement trends, and knowledge retention, you can make informed choices about where to optimize content and where to invest for growth.
Here are some tips to get started:
- Improve course content by identifying lessons with low engagement, high drop-off rates, or poor quiz performance.
- Measure training ROI by tracking course completion rates, certification pass rates, and post-training performance metrics
- Guide business strategy by using analytics to decide which courses to expand, which topics need deeper coverage, and where to allocate resources for maximum learner success.
With advanced analytics, your team can make strategic investments in content development, optimize marketing efforts, and ensure training initiatives align with key business goals.
3. Identifying Gaps in Training
One of the biggest challenges in learning and development is ensuring that knowledge gaps are identified and addressed before they impact learner success. LMS analytics provide the insights needed to make targeted improvements.
Here are some tips to get started:
- Monitor quiz and assessment performance to spot areas where learners struggle and reinforce difficult concepts.
- Analyze drop-off points to determine where engagement declines and make improvements to course structure or content delivery.
- Use learner feedback surveys to cross-reference self-reported comprehension with performance data, ensuring content meets learner needs.
With advanced analytics in your toolkit, , you can automate alerts for low quiz scores, track real-time completion trends, and make proactive adjustments to support learners.
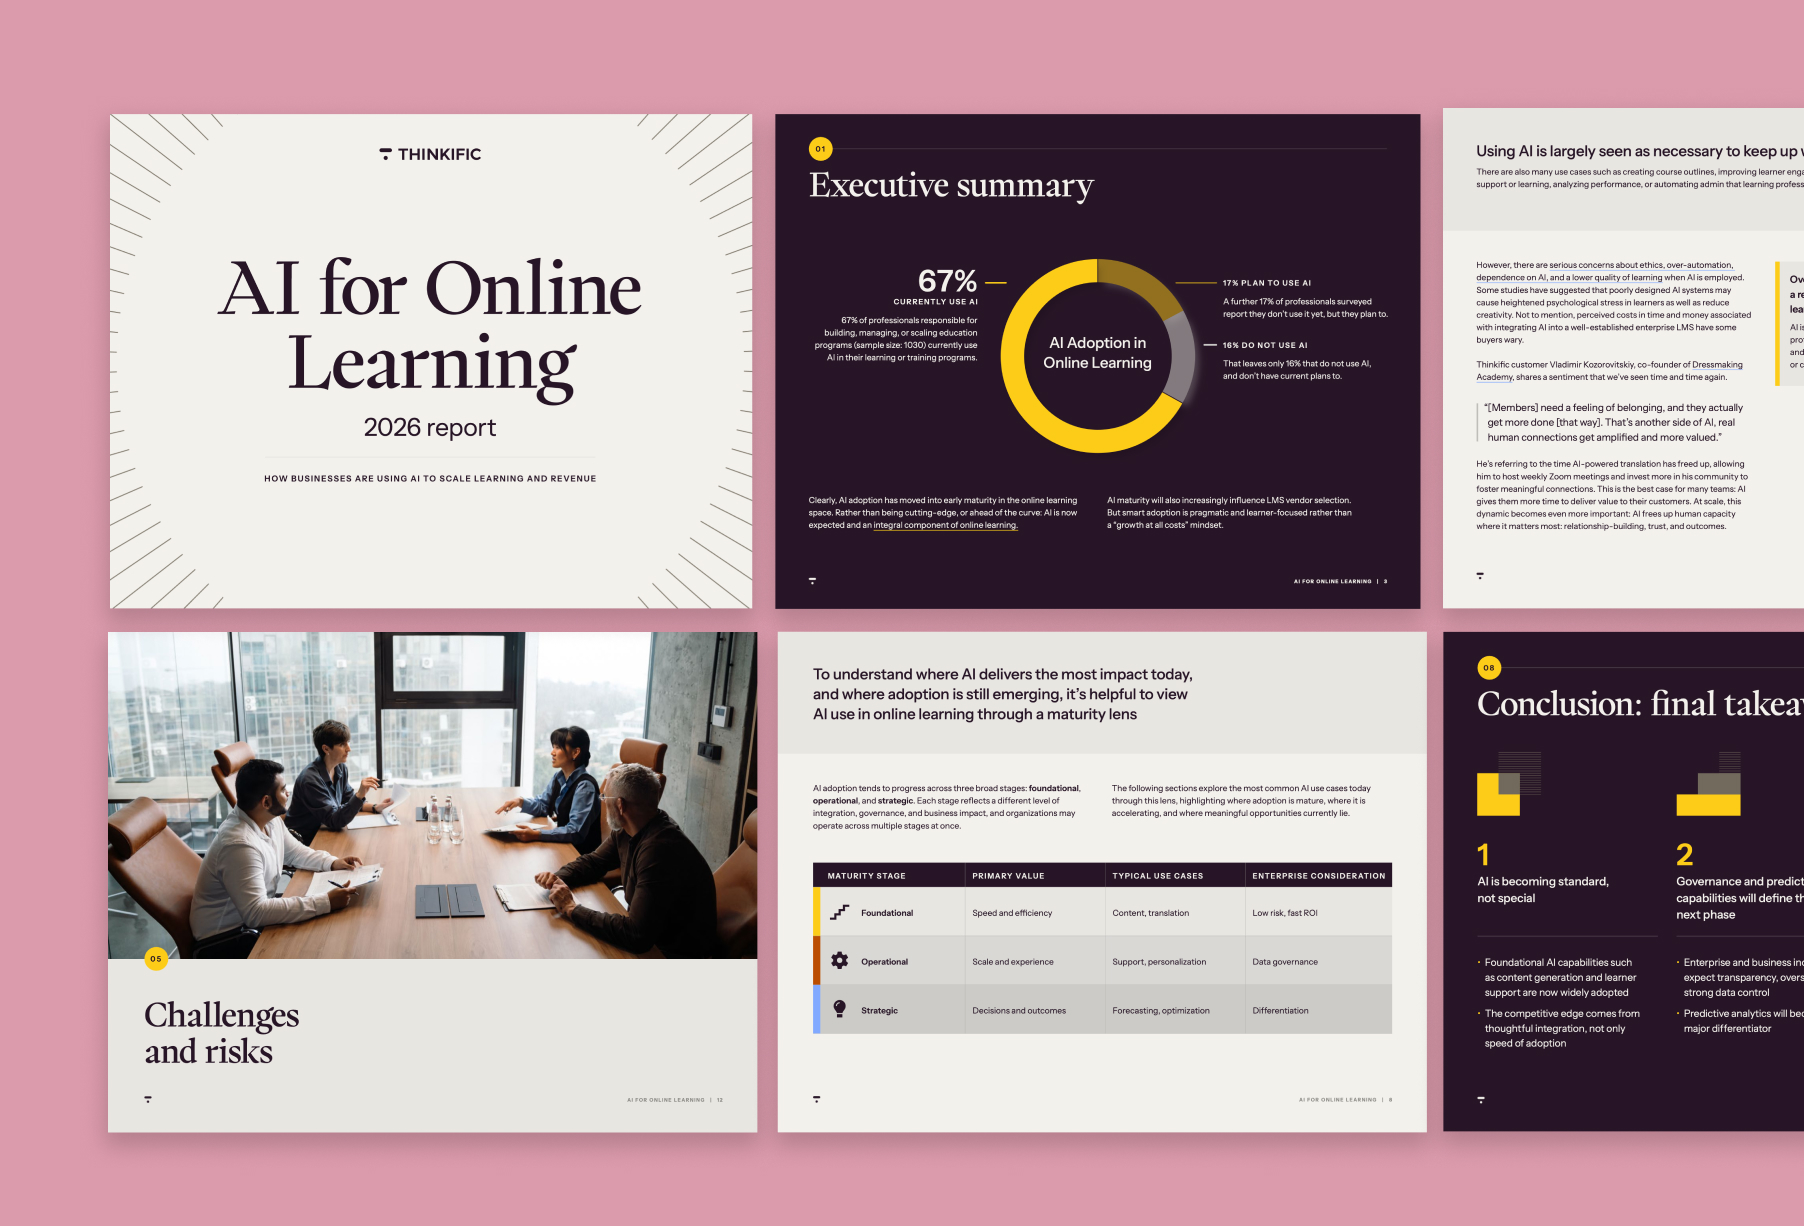
Get the 2026 AI for Online Learning Report
67% of professionals responsible for learning and training programs already use AI in their learning initiatives. Another 17% plan to adopt it soon.
Don’t get left behind. The AI for Online Learning: 2026 Report explores where AI is delivering value today for businesses, and what comes next.
Why These Insights Matter
By leveraging LMS analytics, you and your team can:
- Deliver personalized, engaging learning experiences that increase knowledge retention and course completion rates.
- Make informed decisions about improving content, adjusting training methods, and investing in new learning initiatives.
- Demonstrate the impact of training on business outcomes by linking engagement data to performance improvements and customer retention.
Using Thinkific Plus’s Advanced Analytics
Insights For Data-Driven Learning
Thinkific Plus offers a robust advanced analytics suite designed to provide businesses with real-time insights into learner behavior, course performance, and engagement trends.
With customizable dashboards, automated reporting, and video engagement analytics, Thinkific Plus helps organizations track and optimize their learning programs with precision.
Key Features of Thinkific Plus Advanced Analytics
| Feature | What It Does | Why It Matters |
| Custom Dashboards | Create and personalize dashboards with key learning metrics. | Ensures stakeholders access relevant insights in real time. |
| Engagement Dashboards | Analyze student activity in courses, communities, and videos. | Helps optimize content and improve learner retention. |
| Real-Time Reporting | Provides up-to-date data on enrollments and course activity. | Enables data-driven decision-making without delays. |
| Automated Report Scheduling | Sends scheduled analytics reports to stakeholders automatically. | Saves time and ensures data is delivered when needed. |
| Video Engagement Metrics | Tracks play rates, watch times, and rewatch segments. | Helps refine video-based learning content. |
| Data Visualization | Displays learning trends using customizable graphs and charts. | Makes it easier to analyze and act on data insights. |
Thinkific Plus Advanced Analytics helps businesses automate reporting, track learner progress in real-time, and optimize learning content based on actionable insights.
How Thinkific Plus Helps Businesses Make Smarter Decisions
Beyond tracking learner engagement, Thinkific Plus’s analytics suite empowers your business to make data-driven decisions at both the training and organizational level.
With deeper insights, you can:
- Refine your learning programs by analyzing engagement patterns and identifying what content resonates most with learners.
- Improve learner retention by detecting drop-off points and taking proactive steps to re-engage students.
- Demonstrate training impact by linking learning outcomes to business objectives, such as customer retention, revenue growth, or team performance.
- Save time and streamline workflows with automated reporting and real-time dashboards that deliver insights without manual effort.
By leveraging Thinkific Plus’s advanced analytics, your organization can make smarter, more strategic decisions about learning initiatives, ensuring long-term success.
Choosing the Right LMS for Your Business
When selecting an LMS with advanced analytics, consider the following factors:
- Do you need real-time insights? Select a platform that provides live tracking, while others rely on periodic reports.
- Is customization important? Select a platform that allows you to build tailored dashboards for your needs.
- Do you need video analytics? Select a platform that excels in tracking video engagement for multimedia-heavy courses.
Thinkific Plus stands out for its ease of use, customizable analytics, and automated reporting, making it an ideal choice for businesses focused on learner engagement and training impact.
Is Thinkific Plus the Right LMS for Your Business?
When selecting an LMS with advanced analytics, consider the following factors:
- Do you need real-time insights? Thinkific Plus provides live tracking, ensuring instant access to engagement and performance data.
- Is customization important? With custom dashboards and flexible reporting, Thinkific Plus allows businesses to tailor analytics to their unique needs.
- Do you rely on video content? Thinkific Plus excels in tracking video engagement, helping organizations optimize multimedia learning experiences.
With its intuitive design, customizable analytics, and automation capabilities, Thinkific Plus is an ideal solution for businesses looking to enhance their learning programs with data-driven insights.
Tips for Implementing LMS Analytics Effectively
LMS analytics are only valuable if they are used strategically. Simply having access to data isn’t enough—you and your team need a plan to interpret insights, act on them, and continuously improve your learning programs.
Here’s how to effectively implement LMS analytics to optimize your training strategy and drive business results.
1. Set Clear Goals for Your Analytics Strategy
Before diving into data, define what success looks like for your learning programs. Without clear objectives, tracking analytics can become overwhelming and unfocused.
- Identify key learning outcomes – What do you want your training programs to achieve? Higher course completion rates? Better retention? Faster onboarding?
- Select relevant metrics – Focus on the data that aligns with your business objectives. For example, if your goal is to improve learner engagement, track video watch times and participation rates in learning communities.
- Use benchmarks – Compare current analytics to past performance to measure progress over time.
Thinkific Plus’s customizable dashboards allow you to track the metrics that matter most to your business, ensuring your analytics align with strategic goals.
2. Enable Your Team with the Right Training
To get the most value from your LMS analytics, ensure that your team understands how to use the data effectively.
- Provide analytics training – Offer onboarding sessions or guides to help instructors, admins, and business leaders interpret analytics reports.
- Create a shared analytics dashboard – Make key data accessible to relevant team members so they can monitor trends and take action.
- Encourage a data-driven culture – Regularly discuss insights in team meetings and strategize based on data rather than assumptions.
With Thinkific Plus’s automated reporting, teams can receive scheduled analytics updates, keeping everyone informed without manual effort.
- Use Data to Personalize Learning Experiences
One of the biggest benefits of LMS analytics is the ability to tailor learning experiences to individual needs. Instead of offering a one-size-fits-all approach, use engagement and performance data to make learning more relevant and effective.
- Segment learners based on engagement levels – Identify which students are highly engaged and which need additional support.
- Trigger personalized interventions – If analytics show that learners are struggling with a module, provide additional resources or encourage instructor outreach.
- Optimize pacing and course structure – Use time-to-completion data to refine how content is delivered. If learners are dropping off mid-course, consider restructuring the material for better engagement.
Thinkific Plus’s advanced analytics help track learner behaviors in real-time, allowing you to adjust learning paths dynamically.
4. Regularly Review and Adjust Your Strategy
Analytics are most effective when reviewed consistently. Make it a habit to assess training performance regularly and make improvements where needed.
- Schedule monthly or quarterly analytics reviews – Identify trends over time and measure progress toward goals.
- Test and optimize content – If completion rates drop in a specific module, experiment with different formats (videos, quizzes, interactive elements) to boost engagement.
- Use data to iterate – Learning programs should evolve based on learner feedback and performance insights.
Thinkific Plus allows businesses to automate reports and monitor engagement dashboards over time, ensuring learning programs stay optimized.
5. Integrate LMS Analytics with Other Business Systems
To maximize impact, your LMS analytics should work alongside other business tools—such as CRM platforms, HR software, and marketing automation tools.
- Sync learning analytics with business KPIs – Align training data with broader company goals, such as customer retention or employee performance.
- Automate reporting workflows – Use integrations to share insights between departments, ensuring training efforts contribute to overall business success.
- Use analytics to guide product and service improvements – If customer training data shows confusion around a certain feature, work with product teams to enhance documentation or onboarding.
Thinkific Plus’s analytics can be integrated into external reporting tools, enabling deeper business insights beyond learning metrics.
Why These Tips Matter
By strategically implementing LMS analytics, your team can:
- Track and improve learner engagement based on real-time data.
- Make informed decisions about content optimization rather than guessing.
- Ensure learning programs align with business goals for maximum impact.
- Increase efficiency with automated reporting and integrations across teams.
With Thinkific Plus’s advanced analytics, you can seamlessly monitor training effectiveness, optimize content, and drive continuous improvement—all from a centralized dashboard.
Future Trends in LMS Analytics
As learning management systems evolve, LMS analytics are becoming more sophisticated, incorporating predictive insights, AI-driven automation, and gamification to improve learner engagement and training effectiveness. Organizations that embrace these advancements can stay ahead of training trends, optimize learning experiences, and drive better outcomes.
Below are key trends shaping the future of LMS analytics and their impact on learning programs.
Predictive Analytics in Learning: Personalized recommendations and insights, benchmark analytics
Predictive analytics in LMS platforms leverages historical data to forecast learner behavior, identify at-risk students, and recommend personalized learning paths. By analyzing engagement trends, quiz performance, and completion rates, predictive models can help organizations proactively adjust training programs.
- Personalized recommendations provide learners with tailored course suggestions based on their progress and past interactions
- Benchmark analytics compare learner performance against industry or company-wide trends, helping organizations set data-driven learning goals
- Early intervention strategies allow instructors to identify struggling learners and offer targeted support before they disengage
Predictive analytics helps organizations shift from reactive course adjustments to proactive learning optimization, ensuring more effective training programs.
AI and Machine Learning in LMS
AI-powered analytics automate data processing, uncover patterns in learning behavior, and enhance training programs through continuous insights. Machine learning algorithms can analyze vast amounts of learner data to improve engagement and knowledge retention.
- Automated insights reduce manual reporting by continuously monitoring engagement trends and highlighting key learning patterns
- Adaptive learning paths adjust course content dynamically based on individual learner progress and knowledge gaps
- AI-driven content recommendations suggest additional resources or alternative learning formats tailored to individual preferences
By integrating AI and machine learning into LMS analytics, organizations can streamline administrative tasks, personalize training at scale, and make more informed decisions about curriculum design.
Gamification and Behavioral Insights
Gamification in LMS platforms enhances motivation and engagement by incorporating elements such as badges, leaderboards, and achievement tracking. Analytics can measure how these gamified components influence learning outcomes.
- Engagement tracking monitors how learners interact with gamified elements, identifying which incentives are most effective in driving participation
- Behavioral analytics assess how motivation techniques impact course completion rates, knowledge retention, and long-term learner engagement
- Performance-based learning incentives allow organizations to structure rewards based on real-time learner progress and achievements
Gamification analytics help organizations refine their engagement strategies, ensuring that training programs are both interactive and results-driven.
LMS Analytics FAQs
- What are LMS Analytics?
LMS analytics refer to the collection, measurement, and analysis of data related to online learning and training programs. These insights help organizations track learner progress, monitor course performance, and improve training strategies.LMS analytics typically include:- Learner engagement metrics (time spent on courses, participation in discussions, quiz attempts)
- Course completion rates (how many learners finish a course versus drop out)
- Knowledge retention indicators (quiz scores, assessments, survey feedback)
- Progress tracking (individual and group learning trends over time)
By analyzing this data, organizations can identify learning gaps, enhance course content, and measure the impact of training on business outcomes.
- What are Advanced Analytics?
Advanced analytics go beyond basic LMS reporting by offering deeper insights into learning patterns, real-time tracking, and predictive modeling. Unlike standard LMS analytics, which focus on static reports, advanced analytics provide:- Custom dashboards that allow organizations to track the specific metrics most relevant to their goals
- Real-time reporting that enables immediate adjustments to training strategies
- Predictive analytics that forecast learner success and highlight areas where interventions may be needed
- Engagement heatmaps that visualize how learners interact with content, helping to optimize course design
Advanced analytics empower organizations to take a proactive, data-driven approach to improving training effectiveness.
- How can LMS Analytics improve corporate training?
LMS analytics help organizations optimize their corporate training programs by providing data-driven insights into learning behavior and skill development.- Personalized learning experiences – Analytics allow organizations to tailor training based on individual progress and performance, ensuring employees receive relevant and targeted learning materials.
- Increased training efficiency – By identifying where learners struggle or disengage, organizations can refine training content, making it more effective.
- Measuring ROI of training programs – LMS analytics link learning outcomes to business performance, helping companies determine whether training is improving productivity, customer satisfaction, or compliance adherence.
- Proactive skill development – With predictive analytics, organizations can identify skills gaps and provide additional resources to employees before performance issues arise.
LMS analytics provide a structured way to assess the effectiveness of training initiatives and continuously improve learning experiences.
- What are some examples of LMS Analytics tools?
Many LMS platforms offer built-in analytics, while others integrate with external data tools. Some common LMS analytics tools include:- Custom LMS dashboards – Provide an overview of learner engagement, course completions, and performance trends.
- Engagement dashboards – Track student interaction across courses, communities, and multimedia content.
- Video analytics – Measure video play rates, watch times, and rewatch behaviors to assess content effectiveness.
- Automated reporting tools – Generate scheduled reports for stakeholders without manual effort.
- Integration with business intelligence tools – Some LMS platforms connect with BI tools like Google Data Studio, Power BI, or Tableau for advanced reporting.
The right analytics tool depends on an organization’s training goals and the level of insight needed for decision-making.
- What are the key metrics to track in LMS Analytics?The most important LMS analytics metrics depend on organizational goals, but some key performance indicators (KPIs) include:
- Learner engagement metrics – Tracks participation, time spent on training, and interactions with course materials.
- Course completion rates – Measures how many learners successfully finish a course versus those who drop out.
- Assessment scores and quiz performance – Helps gauge knowledge retention and identify areas for improvement.
- Video engagement metrics – Analyzes how learners interact with video content, including drop-off points and rewatch rates.
- Time-to-completion – Determines how long learners take to complete courses, helping to refine pacing strategies.
By monitoring these metrics, organizations can assess the effectiveness of their training programs and make data-driven improvements.
Get Started with Thinkific Plus Advanced Analytics
Unlock the full potential of your learning programs with Thinkific Plus’s Advanced Analytics. Track learner progress, optimize course content, and make informed decisions—all with a powerful, user-friendly analytics suite.
Ready to enhance your training programs with data-driven insights?
Contact us today for a demo and see how Thinkific Plus can transform your business.