
Features
|
Analytics
Know more, convert more, and grow more with analytics
Get actionable data to help you understand your audience, optimize your courses, and drive lasting growth. Equipped with powerful analytics, you have what you need to transform your growing online learning business.
Stand out from the competition with Thinkific Analytics
Make data-driven decisions
Use advanced insights to guide your content development and marketing strategies, and improve your audience’s experience.
Increase learner success
Identify patterns in engagement and conversion so you can take proactive steps to better meet your audience’s needs
Prove the impact of your program at scale
Track engagement, completion, and revenue to present performance and ROI. Build and automatically send customized reports to leadership, B2B clients, and more.
How teams put
Thinkific Analytics to work.

Custom reports
Create custom reports tailored to your unique needs. Filter and segment your data to focus on the metrics that matter most to you and your business.
Design personalized dashboards to display the key metrics
you need at a glance
Develop tailored reports for each of your partners and
effortlessly distribute them via email when you want
Build a more complete picture of your learners with
advanced survey and engagement data
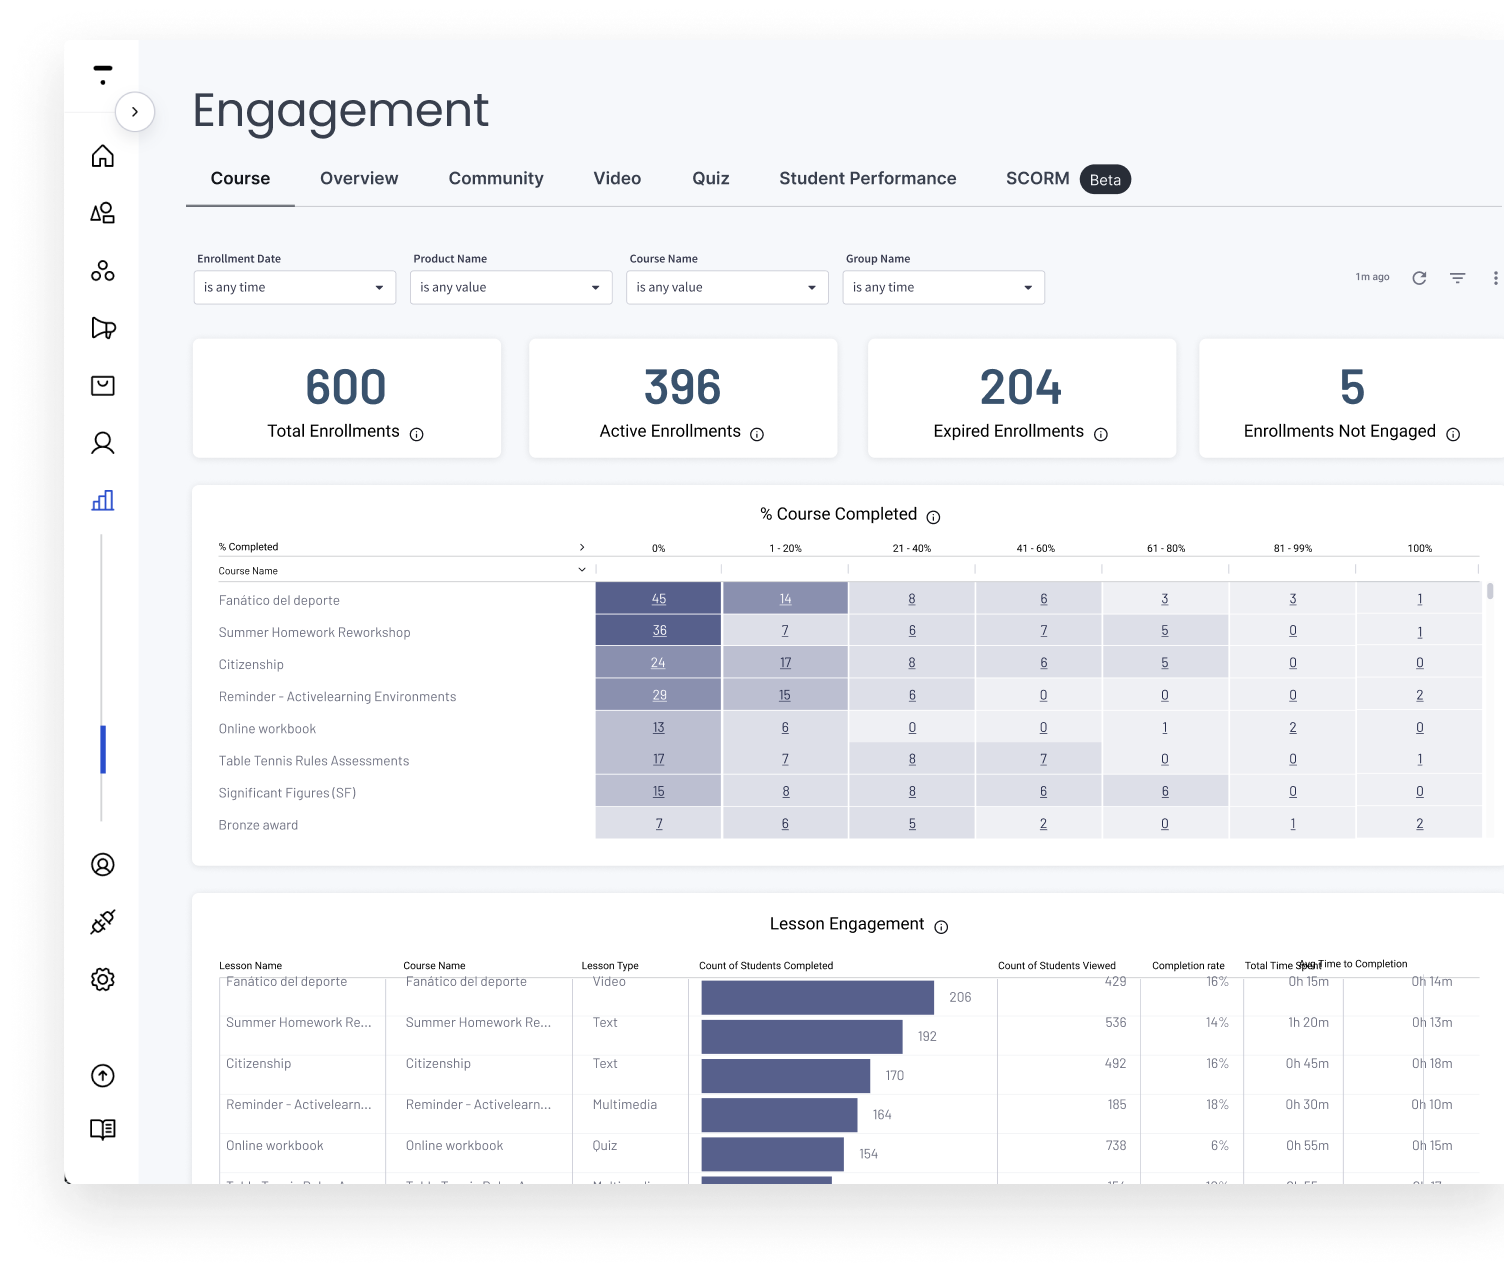
Engagement dashboards
Understand how your students interact with your content. Dive into engagement metrics to see what’s resonating with your audience — and where you can improve.
Measure how learners engage with your content
Analyze quiz results to gauge content comprehension and ensure
your learners are actually gaining value from your content
Gain a comprehensive view of your community’s activity
Use the Communities Analytics dashboard to uncover top
contributors and improve your learning content with real insights
Dive into the progress of individual learners
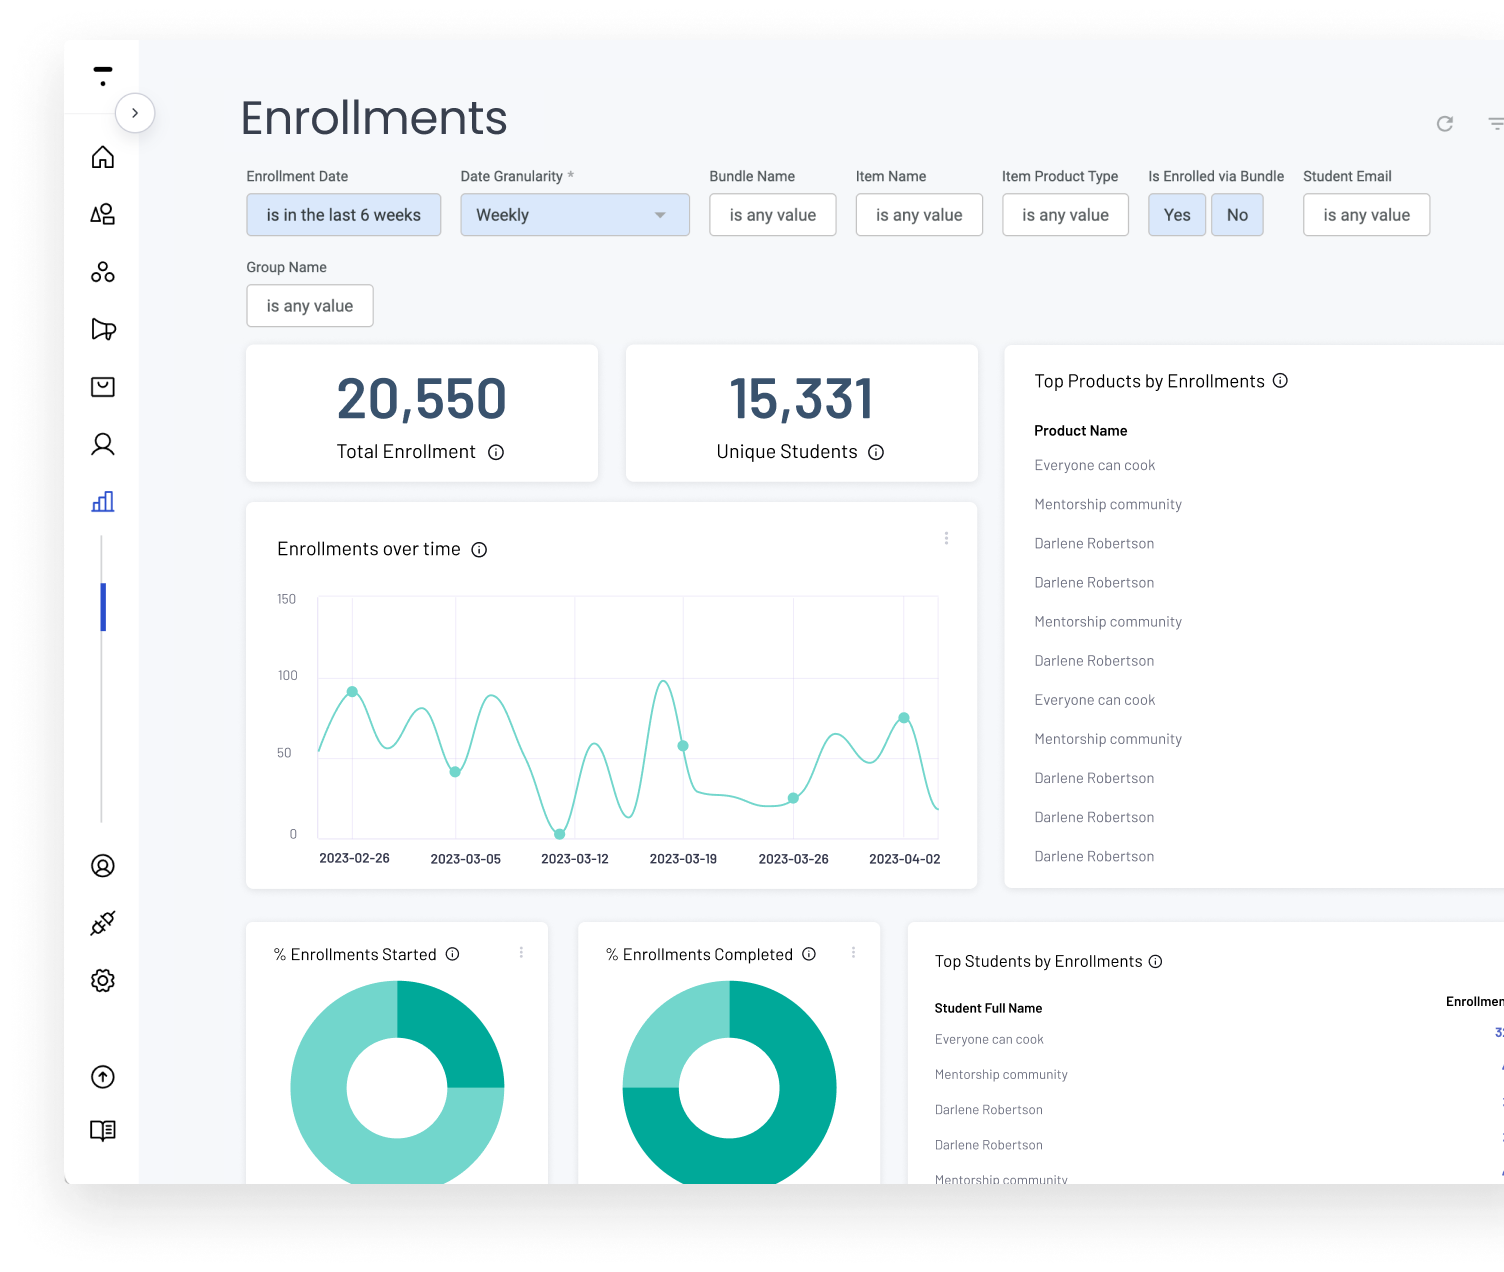
Course enrollments dashboard
Monitor your enrollment trends to understand the growth of your student base. See who’s enrolling in your courses and identify patterns over time.
See how your enrollments change over time
Assess the health of your membership base
Identify which courses attract the most enrollments
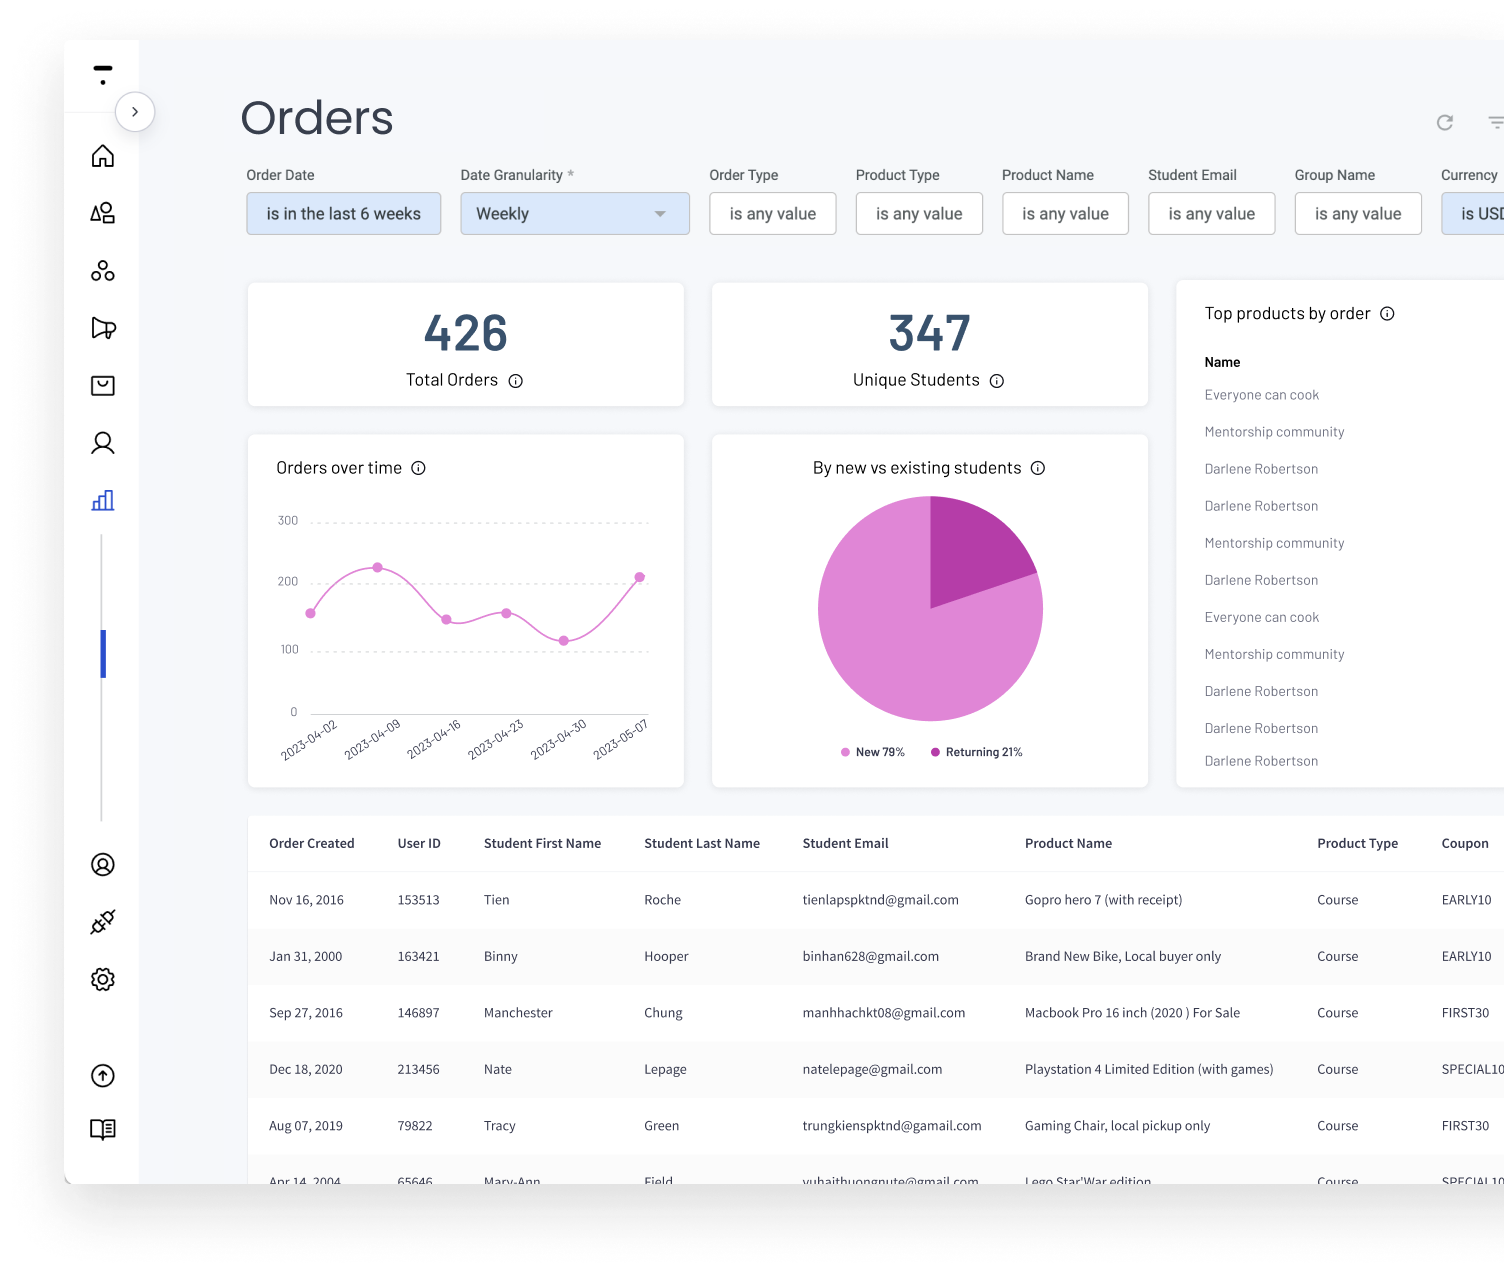
Orders dashboard
Track every order, spot sales trends, and understand your peak selling periods — all from one powerful dashboard. Make smarter marketing decisions by understanding exactly when and how your digital products sell best.
View the total number of orders and sales
Access detailed information about purchasers
(such as referral sources)
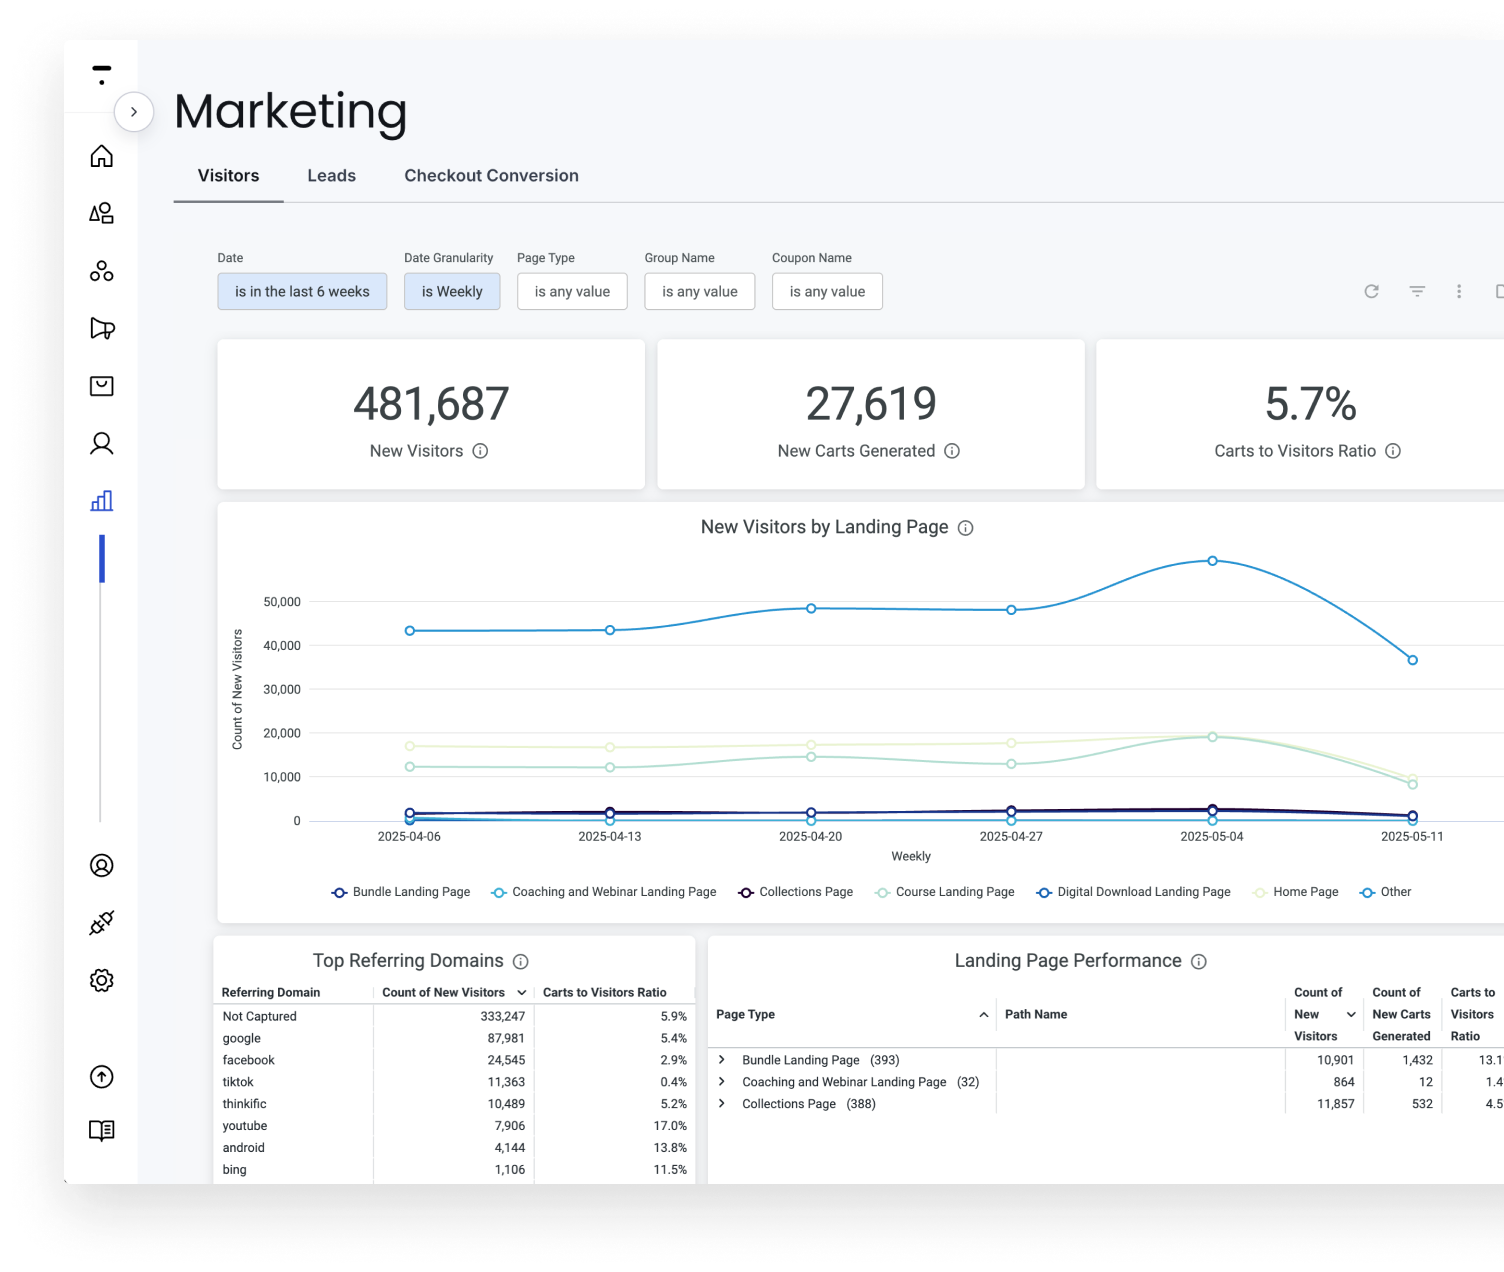
Marketing dashboards
Know where to switch up your marketing efforts with insights on visitor activity and conversion. Learn which marketing channels drive the most traffic and conversions so you can better prioritize where to invest your time.
See how your marketing content is performing
Monitor website and landing page visitor trends
Upsell tools like coupons and order bumps
Measure the effectiveness of lead-generating content
Dive deeper into checkout performance
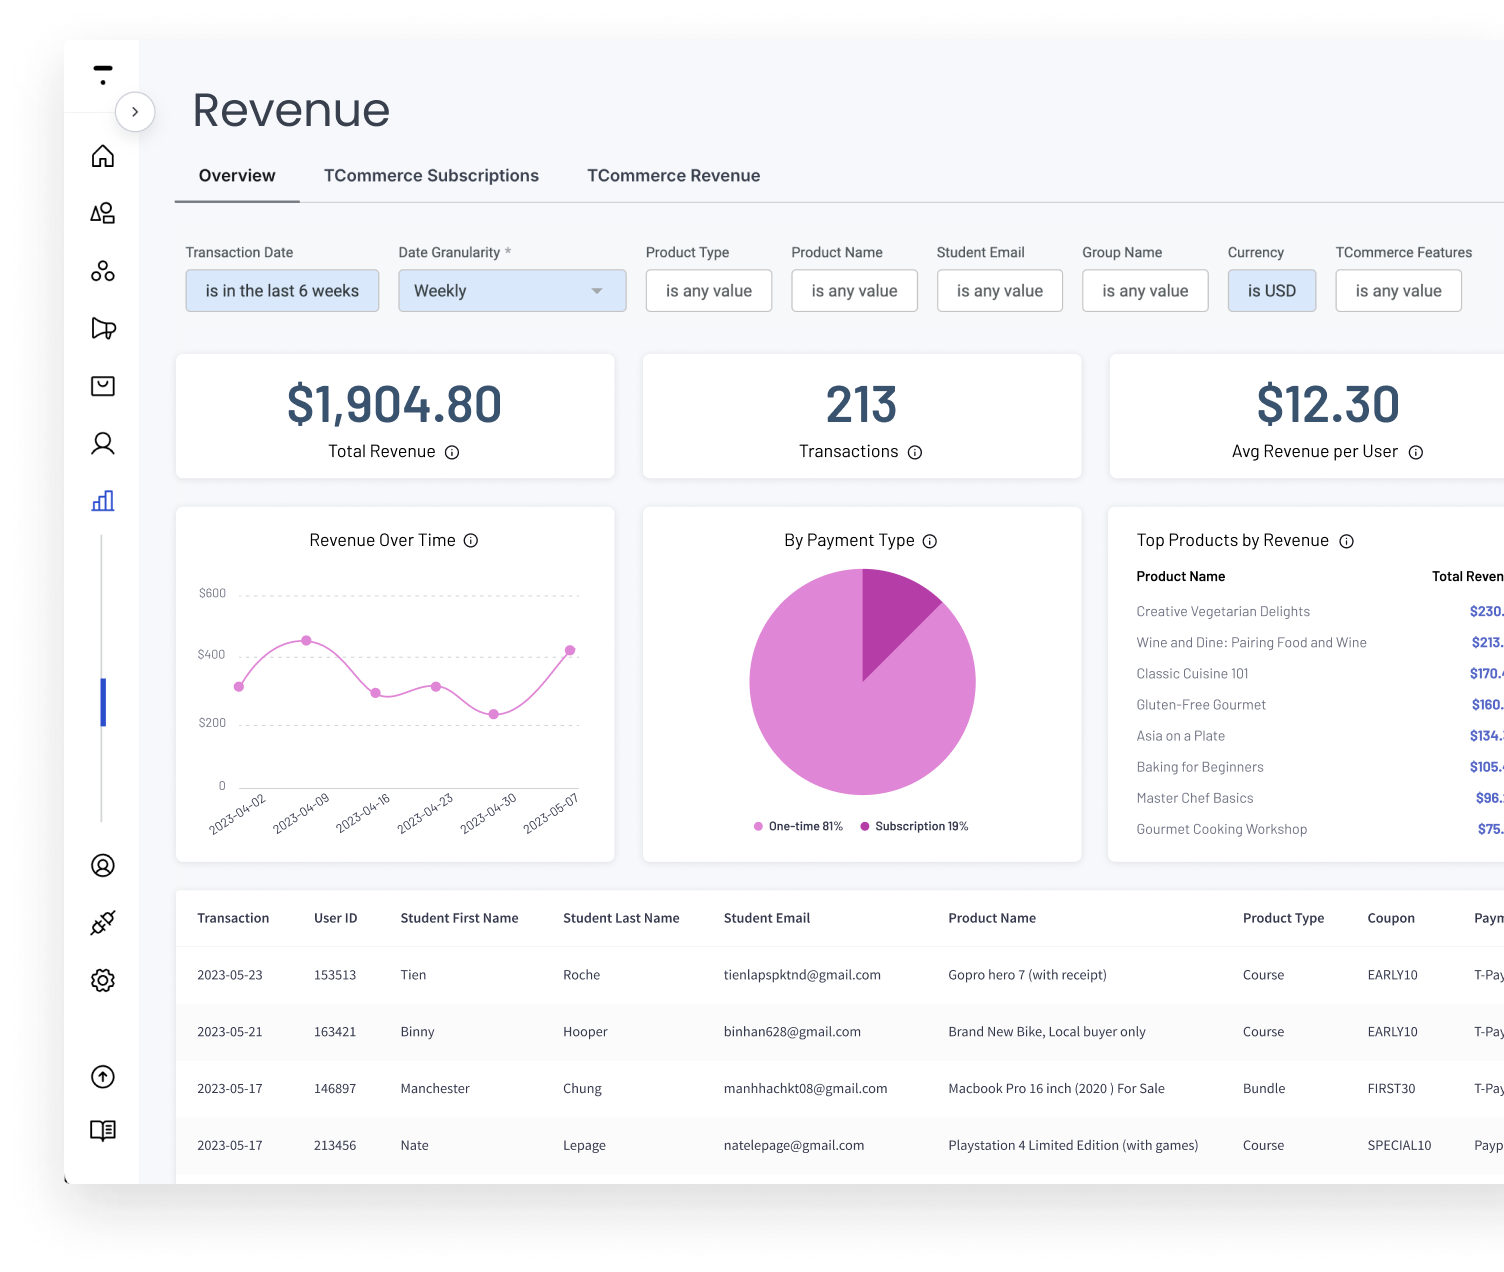
Revenue dashboard
Gain a clear picture of your financial performance. Analyze your earnings and identify trends to better manage your revenue streams.
See your key metrics in one streamlined view
Track your revenue over different periods with revenue reports
See which digital products or sources generate the most income
Plus Exclusive
Go Beyond Dashboards with Advanced Analytics
When standard dashboards aren’t enough, build the views and reports your
business actually runs on, then put them in the hands of every stakeholder who
needs them.
Custom dashboards built for your KPls
Combine learner, revenue, and engagement data in one view. Filter by product, cohort, timeframe, or customer segment to focus on the metrics that matter most to your business.
Role-specific views
Give executives, instructors, and B2B clients dashboards built
for how they work. Each role sees only the metrics relevant to
them, with the right charts, KPIs, and comparisons.
Custom reports for every stakeholder
Build reports with the exact fields and filters each stakeholder needs. Export progress, enrollments, and completions as CSVs to replace manual spreadsheet pulls.
Automated report delivery
Schedule reports daily, weekly, or monthly via email, webhook, S3, or SFTP. Share recurring summaries with executives, clients, or partners without lifting a finger.
Know what’s working, prove it too
See how teams use advanced analytics to track progress, prove compliance, and cut hours of manual reporting — straight from the customers who rely on it.
Frequently asked questions
How often do dashboards refresh?
Most dashboards refresh every 24 hours. Operational pages like Orders and Payouts update in real time so you always see the latest activity.
Can I push my data into our own data warehouse or BI tool?
Yes. Recurring exports and automated delivery via email, webhook or S3 let you blend Thinkific data into your data lake or BI tool, so learning sits alongside every other business metric.
Can I give B2B clients or partners access to their own data?
Yes. Role-based access lets you give partners, clients, or specific team members visibility into only the data relevant to their courses or cohorts. They can self-serve insights without ever requesting a report.
Can I build a dashboard with the metrics that matter most to my team?
Yes. Custom dashboards let you combine learner, revenue, and engagement data in one place, then filter by product, cohort, timeframe, or customer segment.