
Customer success isn’t just a buzzword—it’s a key driver of business growth.
But knowing that customer success is critical is one thing; knowing how to measure it and use that data to fuel retention and revenue growth is another. So, how do you measure customer success effectively? And more importantly, how can you use those insights to scale your business?
In today’s fast-paced market, keeping track of the right customer success metrics and KPIs is essential. These metrics provide a clear snapshot of your customers’ health and satisfaction, helping you identify areas for improvement and growth. When tracked strategically, they can improve customer retention, loyalty, and directly impact your bottom line.
With so many metrics available, it’s easy to get overwhelmed. That’s why we’re breaking down the most relevant customer success metrics for 2026—the ones that matter most for boosting retention, driving customer satisfaction, and ultimately accelerating your business growth.
Keep reading to dive into the top 16 customer success metrics you should be tracking, and discover actionable strategies to help improve them.
Skip ahead:
- Introduction to customer success metrics
- How enhancing customer success metrics drives bottom-line revenue
- Key Customer Success Metrics To Track In 2026
- Strategies To Enhance Customer Success Metrics
- Conclusion
Introduction to customer success metrics
Customer success metrics and KPIs are the backbone of a thriving business strategy. These metrics provide insights into how well your company is meeting customer needs and where there are opportunities to improve. More than just performance indicators, they are essential tools for understanding your customers’ satisfaction, loyalty, and engagement with your product or service.
By tracking the right customer success metrics, you can measure the effectiveness of your customer success efforts and how they impact key business objectives like customer retention, expansion, and lifetime value. These metrics not only reveal where your business stands today but also serve as a roadmap for long-term growth.
Some of the most critical customer success metrics track areas such as customer satisfaction (CSAT), net promoter score (NPS), churn rate, adoption rate, and monthly recurring revenue (MRR). By closely monitoring these metrics, businesses can make data-driven decisions to enhance customer relationships, increase product adoption, and ultimately reduce churn.
In essence, these metrics are more than just numbers: they are powerful indicators of whether your customers are finding value in your products and offerings. And as your business grows, consistently tracking and improving these metrics will ensure that you deliver on your customer promises, while simultaneously driving profitability and scale.
How enhancing customer success metrics drives bottom-line revenue
Improving customer success metrics is one of the most direct ways to boost your company’s revenue, especially in subscription-based or SaaS businesses.
When you focus on customer success, you’re not just aiming to make customers happy—you’re making sure they stay longer, spend more, and recommend your business to others. Each customer success metric you track and improve helps drive more revenue.
Here’s how it works:
1. Reducing Churn means keeping more revenue
Churn refers to the number of customers who stop using your product or service over a certain period. Every time a customer churns, you lose a source of recurring revenue. So, reducing churn directly protects your revenue stream.
- Why it matters: If you reduce churn, you’re holding on to more customers. The more customers you keep, the more revenue you retain from subscription renewals or repeat purchases.
- How it drives revenue: When customers stay longer, they keep paying for your service or product, and that adds up over time. In fact, studies show that even a small 5% reduction in churn can boost profits by up to 95% because loyal customers continue to pay for longer periods, increasing their lifetime value.
Examples of reducing churn:
- Offering personalized support to customers who show signs of disengagement.
- Using customer education programs to help users get the most out of your product, reducing the likelihood they will leave.
- Implementing feedback loops to catch dissatisfaction early and make necessary improvements.
2. Increasing Customer Lifetime Value (LTV) grows long-term revenue
Customer Lifetime Value (LTV) is the total revenue you expect to earn from a customer throughout their entire relationship with your company. The longer a customer stays, and the more they spend, the higher their LTV.
- Why it matters: A higher LTV means more revenue from each customer over time. When you increase LTV, you maximize the return on the initial investment it took to acquire that customer.
- How it drives revenue: By increasing LTV, you generate more long-term revenue without needing to constantly acquire new customers. This allows you to focus on upselling additional services or features, and encouraging customers to renew their subscriptions.
Examples of increasing LTV:
- Creating add-on products or services that enhance the customer’s experience, making it easy for them to upgrade.
- Offering loyalty programs that reward customers the longer they stay, encouraging renewals.
- Implementing customer education programs that train customers to use advanced product features, increasing engagement and the likelihood of expansion.
3. Improving product adoption brings faster revenue growth
Adoption rate measures how quickly and effectively customers are using your product after purchase. When customers adopt your product fully, they start seeing value sooner, which increases their satisfaction and reduces the likelihood of churn.
- Why it matters: If customers don’t understand how to use your product or fail to engage with key features, they might churn. Higher adoption leads to renewals, upsells, and stronger loyalty.
- How it drives revenue: The faster customers adopt your product, the quicker they start realizing its value and justifying their continued investment. This leads to faster renewals and opportunities to cross-sell additional features.
Examples of improving product adoption:
- Offering online courses or tutorials to help customers learn how to use your product effectively.
- Providing a personalized onboarding experience that guides customers through key features and helps them succeed early on.
- Using automated follow-up emails or in-app messaging to check in on progress and offer support as needed.
4. Boosting customer loyalty cuts acquisition costs
Net Promoter Score (NPS) measures customer loyalty and their willingness to recommend your product or service to others. Customers who score high on NPS are more likely to refer your product to others, which reduces the cost of acquiring new customers.
- Why it matters: When customers love your product, they naturally become brand advocates, helping to spread the word. This kind of organic growth costs far less than paid marketing and reduces your customer acquisition cost (CAC).
- How it drives revenue: Loyal customers bring in new business at a low cost. This means you’re not only retaining your current customers but also growing your customer base through referrals, which drives revenue without additional marketing spend.
Examples of boosting customer loyalty:
- Offering exclusive content or benefits to loyal customers, such as early access to new features.
- Implementing customer feedback loops to make customers feel heard and valued, increasing their connection to your brand.
- Encouraging customers to participate in community events, share success stories in case studies, or write testimonials.
5. Upselling and renewals drive recurring revenue
Metrics like average revenue per user (ARPU) and net dollar retention track how much each customer is spending and whether they are increasing their investment in your product over time.
- Why it matters: If customers are renewing their subscriptions and upgrading to higher-tier plans, they are driving more revenue for your business without the need for new customer acquisition.
- How it drives revenue: By focusing on upselling opportunities and ensuring customers renew at higher levels, you create a predictable, scalable source of recurring revenue.
Examples of increasing ARPU and net dollar retention:
- Offering tiered pricing plans that encourage customers to upgrade to access premium features.
- Using customer success teams to identify expansion opportunities and help customers discover the full value of your product.
- Providing continuous value through customer education and regular updates to ensure customers remain engaged and satisfied with your service.
Improving customer success metrics doesn’t just foster stronger relationships; it actively boosts profitability and long-term growth for your company. By focusing on metrics that reveal how well you’re retaining customers, driving adoption, and increasing customer satisfaction, you can ensure that your strategies are translating into real revenue gains.
But which specific metrics should you focus on to make the most significant impact on your bottom line?
In the next section, we’ll dive into the 16 key customer success metrics you should track in 2026. These metrics will help you measure and optimize every stage of the customer journey, from monthly recurring revenue and customer lifetime value to adoption rates and churn, so that you can create a comprehensive strategy for success.
Key customer success metrics to track In 2026
To effectively scale customer success and drive business growth, it’s crucial to track the right metrics. But with so many data points available, knowing which ones provide the clearest insight into your customers’ health and behavior can be challenging.
That’s where focusing on key customer success metrics becomes essential. These metrics help you understand customer retention, engagement, and satisfaction, and ultimately provide a roadmap to optimizing your efforts.
By keeping a close eye on these 16 key customer success metrics to track, you can refine your customer success strategy, maximize revenue, and foster long-term loyalty:
Monthly Recurring Revenue (MRR)
MRR is a simple calculation of all your monthly subscription revenue, minus any discounts, refunds, and failed payments. This metric measures the rate at which customers are signing up for your service (or product) and how much they’re willing to pay for it.
If your MRR is increasing, that’s a sign that customers are happy with your product and want to keep using it. Decreasing MRR, on the other hand, indicates that something is wrong and needs to be addressed.
How to calculate MRR
Here’s how to calculate your MRR in the SaaS industry:
MRR = Number of monthly users x average revenue per user.
Finding the average revenue per user can be a bit tricky, as it should involve
- The average subscription price
- Any discounts or promotions
- Upgrades and downgrades
Sometimes, companies will calculate gross and net MRR:
- Gross MRR is the total revenue before any discounts.
- Net MRR is the total after all discounts and adjustments have been applied
The more information you can track, the more accurate your MRR calculation will be.
Examples of MRR in action
According to data from Nathan Latka, who interviews SaaS entrepreneurs on his podcast The Top, there is a huge gap between median and average MRR. Thanks to their outstanding customer success, some very successful companies are driving the average way up.
In 2020, productivity management company ClickUp was approaching $3 million in monthly recurring revenue after investing heavily in organic growth and customer success. By 2023, they were sitting at $6.7 million MRR and had strong retention and expansion numbers.
MRR became a key metric for ClickUp, and they took it seriously. They scaled their customer success team and created content that drove organic growth.
Customer Lifetime Value (LTV)
Customer Lifetime Value (LTV) is the estimated value of a customer’s relationship with your business. It considers factors such as how much money they’ve spent on your product or service, how long they remain customers, and their potential to refer other paying customers.
By monitoring LTV, you can understand how worthwhile your customer success efforts are. If LTV is increasing, it’s a sign that customers are happy with your product and want to keep using it.
How to calculate LTV
Calculating your LTV is relatively straightforward. You simply need to multiply the average revenue per user (ARPU) by the length of time they are expected to remain a customer.
Here’s how to calculate your LTV in the SaaS industry:
LTV = ARPU x Customer Lifetime
For example, let’s say you have a SaaS product that charges customers $40/month and, on average, they stay with you for 18 months:
LTV = 40 x 18 = $720
This is a general estimate since customer lifetime and ARPU can fluctuate monthly. But it gives you a good starting point for understanding the value of your customers and how to allocate resources accordingly.
Examples of LTV in action
When Slack went public in 2019, Anand Vatsya of Medium did a deep dive into their financials. Their customer acquisition cost was ballooning at the time, reaching $7,650. That came hand-in-hand with an average customer lifetime value of $99,000, though, meaning that the company was still making a healthy profit and could invest in growth.
Nearly 40% of the company’s revenue came from “heavy customers,” with annual revenue exceeding $100,000.
The success of Slack and other SaaS companies is a testament to the importance of LTV. By understanding their customers’ needs and providing exceptional service, they increased customer loyalty – and drastically improved their bottom line.
Customer Satisfaction Score (CSAT)
Customer Satisfaction (CSAT) is one of the most straightforward yet powerful metrics for gauging how customers feel about your product or service. It measures the immediate satisfaction customers experience after an interaction, providing valuable insights into areas that may need improvement. This metric typically involves asking customers to rate their satisfaction on a scale, such as 1 to 5 or 1 to 10, and gives you a direct snapshot of customer sentiment.
How to calculate CSAT
To calculate CSAT, you ask customers a simple question after they’ve engaged with your product or service—something like, “How would you rate your overall satisfaction with your experience?” They respond by selecting a score, usually on a scale like 1 to 5 or 1 to 10.
To get your CSAT score:
- Take the number of positive responses (usually ratings of 4 or 5 on a 5-point scale).
- Divide this by the total number of responses.
- Multiply the result by 100 to get the percentage.
CSAT Formula = [ Number of Positive Responses / Total Responses x 100 ]
For example, if you receive 200 responses and 160 of them are positive, your CSAT score would be:
[ 1600 / 200 x 100 = 80% ]
This means 80% of your customers are satisfied with their experience. CSAT is crucial for tracking short-term satisfaction and pinpointing immediate areas for improvement.
Examples of CSAT in action
When Thinkific migrated its support team to Zendesk, automating help tickets and improving response times, CSAT scores went through the roof.
By reaching a 91.7% CSAT score, they were able to secure new customers, increase their customer retention rate, and show that they could provide a better user experience.
Net promoter score (NPS)
Net Promoter Score (NPS) is a metric linked to CSAT but measures customer loyalty rather than satisfaction. It’s based on a single question: “How likely are you to recommend [product/service] to a friend or colleague?”
While overall satisfaction starts any customer success journey, loyalty is the end goal. A high NPS indicates that customers are not only satisfied but actively promoting your product or service to others.
How to calculate NPS
When calculating NPS, there will be three categories customers will be divided into, depending on their response to the question “How likely are you to recommend [product/service] to a friend or colleague?” on a 1-10 scale.
- Promoters (9-10): These are the customers that actively promote your product or service.
- Passives (7-8): These are the customers that are satisfied but don’t necessarily go out of their way to recommend it.
- Detractors (0-6): These are the customers who have a negative experience and would not recommend your product/service.
The NPS score is then calculated by subtracting the percentage of Detractors from Promoters, which gives you an overall score between -100 and +100.
For example, if you surveyed ten customers and their responses were 4-5-6-6-7-9-9-10-10-10, then you would have four detractors (40%), one passive (10%), and five promoters (%50).
NPS Formula = % Promoters – % Detractors
Your NPS score would be 10 (50%-40%). That number would be considered low, but it’s important to note that the absolute NPS score is less important than how it changes over time.
By routinely tracking NPS, you can get an idea of how customers feel about your product/service and if their opinion is improving or declining.
Examples of NPS in action
One thing that can conflate NPS numbers is true advocacy. In 2019, Christina Stahlkopf wrote a piece for the Harvard Business Review that examined public companies like Twitter, American Express, and Burger King.
She found a potential misclassification of advocates and detractors, groups that are not necessarily exclusive.
Burger King, for instance, had an NPS of 30 at the time. Forty-five percent of customers were promoters, and 15% were detractors. But when her company dug deeper, they found that 79% of customers had actually recommended the fast food brand, while just 2% had told others to avoid it.
That “earned advocacy score,” as Stahlkopf called it, was significantly higher than the NPS score.
This is where qualitative customer success metrics come into play. In addition to tracking NPS, it’s important to include qualitative metrics like customer feedback and surveys that can give you more insight into how customers feel about your product or service.
Product Adoption Rate
Product Adoption Rate measures how successfully customers are incorporating your product into their regular workflows. It indicates the percentage of new users who adopt and actively use a product or feature over a specified time period. High adoption rates signal that customers see value in your product, while low rates suggest that additional support, education, or product improvements may be needed to drive engagement.
A 30% adoption rate shows that nearly one-third of users have embraced the feature. Monitoring this metric can help identify which features resonate most with customers and guide improvements to boost engagement with the product or service.
If you release a new feature with a low adoption rate, for instance, you’ll need to invest more resources into user education and training. Or, it can be a sign that the feature isn’t what customers need. With appropriate tracking, companies can identify:
- Which features are being used
- How often they’re being used
- What customers need to become successful
For managers looking to make business cases to invest in customer success initiatives, adoption rate can be a powerful metric.
How to calculate Product Adoption Rate
Adoption rate is typically calculated as a percentage by dividing the number of new customers who have signed up for a product or service by the total number of customers exposed to it.
Product Adoption Rate = New Users Who Adopted The Product / Total Number of Users Exposed To The Product x 100
For example, a company called “Widget Co.” has 500 users that were exposed to a new feature, and 150 of them started using it regularly, the product adoption rate would be:
Product Adoption rate = 150/500 = 30%
Examples of product adoption rate in action
There’s no better example of adoption rate driving customer success than OpenAI’s ChatGPT, which reached 100 million users just two months after its launch.
UBS analysts wrote: “In 20 years following the internet space, we cannot recall a faster ramp in a consumer internet app.” On the back of this adoption, OpenAI released a monthly subscription offering, allowing customers to pay for more advanced features and access.
While product excellence is one obvious driving factor in adoption rate, several other things can impact it.
- Effective onboarding
- High-quality customer support
- Educational content and resources
- Net promoter score
- Customer health score
It can also help to look at how customers interact with your product or service. Are they using it often, or are their interactions sporadic? Does usage increase over time, or do users tend to drop off after a certain period of time?
Adoption rate can give you a look behind the curtain for the customer experience, and allow you to better tailor future releases to their pain points.
Churn
While the first five can all indicate customer sentiment, churn is the key metric for customer success. It’s a measure of how often customers are leaving your service or product. The lower the churn rate, the more successful your customer retention efforts will be.
Your goal should always be to reduce churn as much as possible by identifying and addressing any issues that keep customers from sticking around. This could include features, pricing, or customer service issues that need to be addressed in order for customers to remain satisfied with your product or service in the long run.
How to calculate churn
There are a few different ways you can calculate churn. The simplest way is to subtract the number of customers at the end of a certain period from the number at the beginning, and then divide that by the total number at the start of that period.
For example, if you had 100 customers in January and 95 in February, your churn rate would be 5%. That means you lost five customers over that month-long period.
But that doesn’t necessarily tell the whole story. You could have lost 75 customers during that period and landed 70 new ones through marketing efforts. A 5% churn rate would be misleading.
So the more effective method is to look at a segmented user base that does not include any new customers.
Then apply the following formula:
Churn = Number of customers lost / Number of customers at the start of period
This will give you an accurate picture of how many users are leaving the service and give you a number to use in forecasting.
For example, if you had 100 customers at the start of a month and 10 left, your churn rate would be 10%.
Examples of churn in action
While the average churn rate for the SaaS industry is 5%, this number can vary wildly depending on a number of factors.
Statusbrew, a social media management platform that works with businesses like Ford, Samsung, and Spotify, wrote a case study on how they achieved a 20% churn reduction.
Some companies can complicate the churn picture, blaming various things for their poor performance. Statusbrew took a different approach, focusing on two simple tasks:
- Figure out why customers leave.
- Encourage them to stay.
While that may sound too simple, it is often easier said than done. Statusbrew opened a new customer success team and implemented a few serious changes. They:
- Integrated live chat
- Redesigned the cancellation page
- Integrated with Slack
- Added an Intercom trigger for canceling customers
- Followed up through email and SMS
These changes, combined with a dedication to better customer service, helped Statusbrew reduce their churn rate by 20% in just one year. It’s a great example of how paying attention to the right metrics can lead to improved customer retention.
Note: learning about the above six metrics and KPIs provides a solid foundation for building a successful SaaS product. The rest of the list gives extra insight that can also help you reach your goals.
Average revenue per user (ARPU)
ARPU is a KPI that measures the average revenue generated by a company for each of its users over a period of time. This is a commonly used metric, especially in subscription or membership-based business models.
How to calculate ARPU
By calculating ARPU, businesses can gain valuable insights into their revenue-generating efficiency on a per-user basis. To calculate ARPU, use this formula:
ARPU = Total revenue / Number of users of customers
The total revenue includes all of the business’ revenue during a given period of time. It includes income from subscriptions, one-time purchases, and any other sources of revenue. The number of users or customers represents the total count of users or customers within the same time period.
Net Dollar Retention
Also known as net revenue retention, this is a metric used by SaaS businesses to measure the growth of revenue from existing customers over a period of time. Generally, it’s measured over a year. The purpose of this metric is to account for both expansion, like upsells, and contraction, like churn or downgrades, within the company’s customer base.
How to calculate Net Dollar Retention
To calculator net dollar retention, you can use this formula:
Net Dollar Retention = Revenue from existing customers at the end of the period / Revenue from existing customers at the start of the period.
The result is usually expressed as a percentage.
Conversion Rate
Conversion rate is a critical metric that measures the percentage of users or leads who complete a desired action, such as signing up for a service, purchasing a product, or upgrading to a premium plan from your company.
It’s a key indicator of how well your product, marketing, or sales strategy is turning potential customers into paying customers, making it essential for assessing the effectiveness of your customer acquisition and engagement efforts.
How to calculate the conversion rate
The formula to calculate conversion rate is simple:
Conversion Rate = Number of Conversions / Total Number of Leads or Users x 100
For example, if 1,000 visitors land on your website and 100 of them sign up for a free trial, your conversion rate would be:
100/100 x 100 = 10%
Customer Health Score
This is a predictive metric used to gauge the overall well-being of a customer’s relationship with your product or service. It assesses how likely a customer is to continue using your product, renew their subscription, or churn.
By tracking engagement levels, product usage, and other key factors, the Customer Health Score helps customer success teams identify high-risk customers and proactively address issues to improve retention.
How to calculate customer health score
Customer Health Score can vary from business to business, depending on the metrics you decide to include. However, a common method for calculating CHS involves assigning weights to different customer-related metrics like product usage, engagement, support requests, and customer feedback.
The formula might look like this:
Customer Health Score = (Sum of Weighted Metrics ) / Total Weight
Here’s an example of metrics you might include:
- Product usage: Frequency and depth of use.
- Engagement: Interaction with customer support, content, or resources.
- Support tickets: Number and nature of help requests.
- Survey feedback: Customer satisfaction or Net Promoter Score.
These metrics are assigned scores, and based on their weighted contribution, you calculate an overall Customer Health Score that reflects how “healthy” or “at-risk” a customer is.
- Why it matters: Monitoring your Customer Health Score helps you identify customers who may need extra support or outreach. A low score could indicate dissatisfaction or poor engagement, helping you proactively reduce churn and increase customer retention.
Cyclic Redundancy Check (CRC)
Cyclic Redundancy Check (CRC) is a type of error-detection mechanism used primarily in digital networks and storage devices to ensure data integrity. For SaaS companies, CRC can help prevent data corruption during transmissions by identifying errors in data blocks and requesting retransmissions. It’s typically applied to software updates, database integrity, and API communications to ensure smooth operations and prevent system failures.
- Why it matters: Ensuring data integrity is critical for maintaining customer trust and satisfaction, particularly in industries where data accuracy is essential.
- Example: If a data transmission error occurs during a customer’s use of your product, CRC ensures that the error is detected and corrected before it impacts the customer’s experience.
How to calculate Cyclic Redundancy Check
CRC uses an algorithm that applies binary division to the data being transmitted, generating a short “checksum” or redundancy code. This checksum is appended to the data and transmitted. Upon receiving the data, the system performs the same calculation and compares the checksums. If they match, the data is considered intact.
While CRC calculations are more technical, here’s a simplified explanation:
Cyclic Redundancy Check = Data Block / Predefined Divisor (Polynomial)
The result of this division (the remainder) is the checksum, which is appended to the original data for error-checking purposes.
Qualitative Customer Feedback
Qualitative customer feedback refers to subjective and descriptive information that customers offer. This feedback is usually related to their experience regarding a SaaS product or service. While quantitative data refers to measurable, numerical insights, qualitative data gives SaaS companies a deeper understanding of customer’s opinions and perspectives about the product.
Some ways to gather qualitative feedback involve surveys, interviews, feedback forms, social media monitoring, and customer support.
How to calculate Qualitative Customer Feedback
While not calculated in a traditional sense like numerical metrics, qualitative feedback can be gathered through open-ended surveys, interviews, and feedback forms. You can analyze this feedback by:
- Categorizing themes: Grouping responses into recurring topics such as “user interface issues” or “positive customer support experiences.”
- Sentiment analysis: Assigning sentiments like positive, neutral, or negative to each comment, then analyzing trends over time. Qualitative feedback provides actionable insights that inform product improvements and enhance customer success strategies.
First Call Resolution (FCR)
This metric speaks to your customer support or service team’s ability to resolve a user’s issue during their first and initial contact or interaction. This might mean addressing software-related problems and fixing the issue by answering questions via phone, online chat, email, or other forms of communication.
Understanding your FCR rate enables you to train and support your customer service team, provide more resources, and dive deeper to identify recurring issues that can be addressed proactively.
How to calculate first call resolution
In order to measure the FCR rate, use the following formula:
First Call Resolution Rate = Number of issues resolved on first contact / Total number of customer inquiries x 100%
Average Session Duration
This term refers to the acreage duration that each user typically interacts with your product or service in one session, indicating their level of engagement.
Knowing this metric can help you to enhance your user experience to reduce churn and lengthen your average session duration.
How to calculate Average Session Duration
To measure the average session duration, you’ll want to sum up the total duration of all user sessions. This involves adding the duration of each individual session during a specific time period.
Next, you’ll use this simple formula:
Average Session Duration = Total duration of all sessions / Number of sessions.
For example, if the total duration of all sessions is 1000 minutes and there were 50 sessions, the average session duration would be 20 minutes per session.
Monthly and Daily Average Users (MAU/DAU)
These are two common metrics that refer to the average number of unique users who have engaged with your product on a daily (DAU) or monthly (MAU) basis. Both of these metrics are key indicators of your overall product adoption.
How to calculate MAU/DAU
To calculate MAU, use this formula:
MAU = Total unique users in a month / Number of days in the month
To calculate DAU, use this formula:
DAU = Total unique users in a day / Number of days in the time frame
SaaS Product Usage Rate
SaaS Product Usage refers to how frequently users engage with key features of your software, giving insights into how essential your product is to their workflow.
Several factors affect the measurement of the product usage rate. Some of these include active users, frequency of use, session duration, and user retention.
How to calculate SaaS product usage rate
Measuring this KPI involves measuring the extent to which users are actively engaging with and utilizing the product. The easiest way to do this calculation is to do the following formula:
Product Usage Rate = Total engagement / Total active users.
- For example, if 500 users interacted with your product’s key features 1,000 times in a week, the usage rate is 2 interactions per user. This metric helps assess whether your product’s features are being fully utilized and provides insights into areas that may require more user education or improvement.
——–
Tracking these 16 key customer success metrics gives you a clear and actionable view of how well your customer success efforts are performing. However, identifying metrics is only the first step. The challenge is to continually improve these metrics and drive meaningful results.
In the following section, we’ll explore strategies to enhance these customer success metrics, from reducing churn to increasing product adoption. With the right tactics in place, you can turn these metrics into levers for sustainable growth and long-term customer loyalty.
Strategies to enhance customer success metrics
Optimize onboarding and education programs
A seamless onboarding experience not only sets the tone for your customer’s journey but also lays the groundwork for long-term success. Making a strong first impression during the onboarding phase is crucial—it’s where your customers first engage with your product, and it’s your opportunity to guide them toward success. Done right, effective onboarding can directly improve key metrics like product adoption, time-to-value, and customer retention.
By utilizing customer education platforms like Thinkific Plus, your company can streamline this process and offer self-guided onboarding courses that customers can complete at their own pace. This ensures they quickly master your product’s key features, helping them realize early wins and increasing their satisfaction right from the start. That’s what SaaS company PayShepherd did, and they reduced customer onboarding time by 75%.
- Why onboarding matters: The onboarding phase is your first chance to show customers the value of your product. It’s where you help them see how your solution meets their specific needs. A well-executed onboarding process does more than just teach—it builds customer confidence and ensures they understand how to get the most out of the product, directly impacting product adoption rates. Without this foundation, customers may become disengaged, increasing the risk of churn.
- Repurpose existing resources for efficiency: Most companies already have a range of onboarding materials, such as webinars, PDFs, support documents, and how-to guides. These existing resources can easily be repurposed into structured, cohesive online courses through a platform like Thinkific Plus. By converting these resources into a more scalable format, you can save time and money for your customer service and customer success teams. This efficiency reduces the need for repetitive, manual customer support interactions, allowing your teams to focus on higher-value activities.
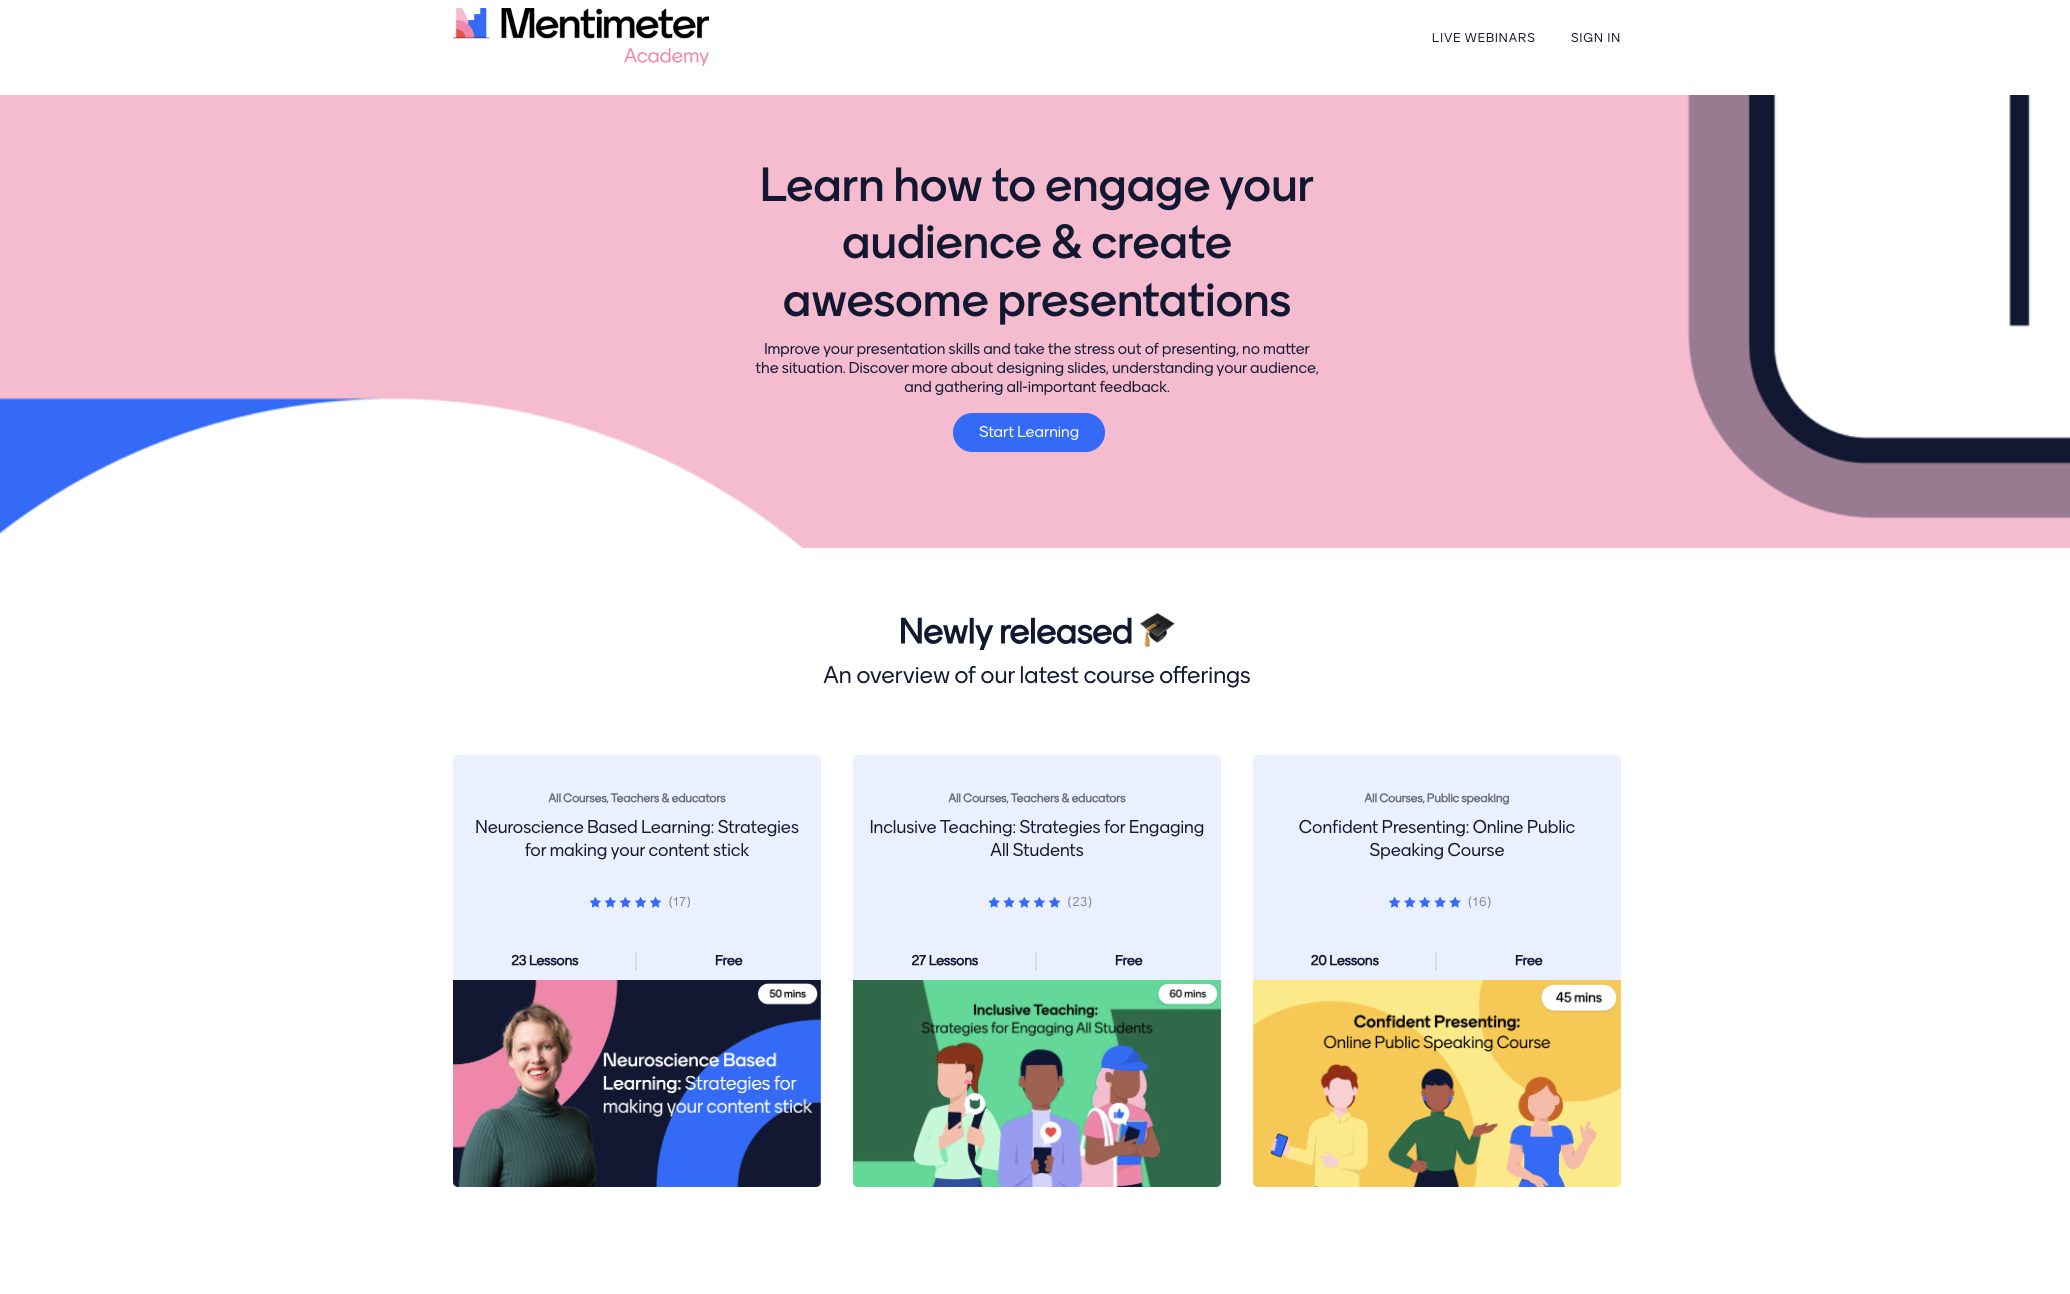
- Start with onboarding, scale into a full customer education academy: A great way to begin is by launching a dedicated onboarding course that guides customers through their first steps with your product. As your needs evolve, you can expand this into a full customer education academy akin to MentiAcademy, offering ongoing educational resources that empower customers to continue learning throughout their journey. This strategy not only improves adoption rates but also strengthens long-term engagement by providing continuous value to your customers. Over time, your academy can house advanced courses, product updates, and specialized training, ensuring customers are always informed and engaged.
Create a Customer Education Academy and knowledge hub
After laying the groundwork with a strong onboarding program, the next step to scaling customer success is to provide ongoing education for customers at every stage of their journey through a Customer Education Academy.
A thriving customer community and centralized knowledge hub not only enhance customer satisfaction but also empower users to take charge of their own learning. This approach reduces the need for constant support while building stronger, more engaged customer relationships.
- From onboarding to ongoing education: Once your onboarding courses are in place, the next natural progression is to develop additional courses and educational resources for intermediate and advanced users. These more seasoned customers will need specialized content to deepen their product knowledge, helping them discover advanced features and applications. Through a customer education academy, your company can continuously provide value to customers long after onboarding. With platforms like Thinkific Plus, you can easily scale your offerings, building out an entire curriculum of self-paced courses, tutorials, and webinars that grow with your customers.
- The power of a knowledge hub: Beyond structured courses, your customer education academy can act as a a centralized knowledge hub for providing ongoing support. This hub can house everything from step-by-step tutorials and how-to guides to product webinars and FAQs. Customers benefit from easy access to educational resources anytime they need help or want to deepen their knowledge, which reduces the pressure on your support teams. Not only does this foster customer independence, but it also creates an environment where peer-to-peer learning can thrive. A vibrant customer community encourages users to share their insights, ask questions, and troubleshoot challenges together—further strengthening the sense of belonging and engagement.
- Scalable solutions for every learning style: One size doesn’t fit all when it comes to learning. Deliver a variety of educational formats—videos, interactive quizzes, downloadable resources, and discussion forums—so customers can engage in the way that works best for them. Whether it’s through an in-depth video course for advanced users or a quick-start tutorial for new customers, this flexible approach ensures your customers feel supported throughout their journey.
- Boost engagement and reduce support costs: By providing these scalable resources, your company can drastically reduce support costs and ticket volume. Customers will increasingly turn to the knowledge hub for answers, whether they’re troubleshooting an issue or learning how to maximize product value. With a strong community in place, they’ll also have the opportunity to learn from one another, further enriching the customer experience.
By combining a robust onboarding experience with a dynamic customer education academy and knowledge hub, your company can elevate key customer success metrics and build lasting, loyal customer relationships.
These strategies help reduce churn, improve product adoption, and empower customers to engage with your product more deeply and independently. As we’ve seen, leveraging customer education platforms offers a scalable, efficient way to enhance the customer journey at every stage.
Conclusion
Customer success metrics are the compass that guides your business toward sustainable growth and long-term customer loyalty. By optimizing onboarding processes, creating scalable education programs, and fostering a community-driven knowledge hub, your company can significantly enhance these metrics.
This approach not only increases customer satisfaction and engagement but also reduces churn and boosts overall retention. Leveraging tools like Thinkific Plus makes it easier to scale these efforts efficiently, ensuring your customer success strategy grows in tandem with your business.
Discover the latest strategies that are shaping the future of Customer Education.
With over 64% of industry leaders now embedding educational programs to enhance customer success and engagement, our Customer Education Benchmarks and ROI Report offers a comprehensive look at how these initiatives are influencing key business outcomes and enhancing ROI.
Download now to gain insights from over 1,100+ customer success leaders.
This was originally written in June 2023. Expanded on January 2026.