Gone are the days when analytics were a “nice to have.” Whether you’re an individual subject matter expert or a full-scale training company, running a digital learning business without analytics is as effective as the old-school game of Battleship. That is to say, you’ll waste time taking shots in the dark.
Complex learning data isn’t just for L&D teams anymore. With today’s dashboards, all of your teams can track metrics, gain insight, and make data-driven decisions that improve the learner experience.
In this article, we’ll explain what LMS metrics and LMS analytics are. Then we’ll dive deep into which metrics you should track and what insights you can derive from them using real-world case studies.
Skip ahead here:
- Final thoughts: make your LMS data work for you
What are LMS analytics?
The term “LMS analytics” refers to the process of collecting, analyzing, and interpreting LMS data, usually with the intent to understand learner behavior and determine the effectiveness of your education initiatives.
Analytics vs. metrics
Analytics and metrics are often (and incorrectly) used interchangeably, so it’s important to understand how they’re different.
Remember those “connect the dots” (or dot-to-dot) drawing pages from elementary school?
Metrics are the dots. Each dot is a piece of raw data: course completion rates, quiz scores, logins, sales, etc.
Analytics is the picture that emerges when you connect those dots. It’s how you interpret the data to understand learner behavior, identify patterns, and make better decisions.
Unfortunately, unlike in those childhood coloring pages, connecting real-world dots isn’t always easy. So, let’s take a look at which analytics matter the most and which metrics feed into them.
LMS analytics to track
Below is a list of the best LMS metrics and KPIs to track:
- Learner engagement: time spent per lesson, course completion rate, video watch time
- Course progress and completion: lesson completion rate, abandonment points, assessment scores
- Knowledge assessment and retention: assessment scores, assessment attempts, pre-test and test scores
- Revenue and sales: revenue by cohort, revenue by product line, average order value (AOV), return on investment (ROI)
- Cohort or group-based metrics: average course completion rate, community participation, general comparative performance
- Support and satisfaction signals: net promoter score (NPS), customer satisfaction score (CSAT), support ticket volume
While this list is robust, it’s not exhaustive. So, let’s dive into each of these analytics more and look at their contributing metrics in more detail.
6 Key LMS performance metrics to track
- Learner engagement metrics
As metrics, learner engagement measures student interactions with your learning content.
As an analytic, learner engagement can help you understand the depth of student investment—whether learners are truly engaged or simply speed-running your course to get it over with.
Common learner engagement metrics:
Here are some common learner engagement metrics and KPIs to pay attention to:
- Time spent per lesson or module – This is the amount of time each learner spends per lesson, module, or course. This metric is most often represented as a sum or average for an observed group of learners.
- Lesson, module, and course completion rates – This data reflects the number of learners who complete a course or a section of it, and is most often represented as a percentage.
- Video views and video watch time – When used as a rate, video views measure how often a video is viewed. When used on an individual basis (per learner), video viewership can function as a completion metric. Video watch time, on the other hand, represents the amount of time a learner or group of learners spent on a particular video.
- Number of discussion posts – This is the measure of posts in a given discussion board, chatroom, forum, or similar communication channel.
- Post likes, comments, and engagements – These are the sum of engagement types, most often measured per learning product or per cohort.
- Assignment submissions – These can be used to measure knowledge retention, but in this context, they’re effectively used as a completion metric, gauging whether or not learners are completing a task.
- Logins over time – This is the number of times a learner accesses your learning product.
It’s important to note that the conclusions you’re able to draw from these metrics entirely rely on learner obligation. Is the training mandated by an employee’s organization or government? Or is participation voluntary?
“When you see a spike in your sales team choosing to take a non-required course on data visualization, for example, it proves they’ve actually bought in on the process,” explains Jason Pack, CRO at Freedom Debt Relief.
“You want to see people actively trying to upskill to meet a business need they’re seeing and better themselves, because that’s better for everyone. If you’re fighting people tooth and nail to complete their training, they’re not invested in it, and the system, not the people, needs to change.”
However, even in mandated scenarios, businesses can still measure engagement and buy-in by tracking metrics in voluntary engagement areas. For example, course completion may be required, but if discussion posts aren’t, measuring discussion postings and post engagements could provide meaningful insight into learner buy-in.
- Course progress & completion rates
As metrics, course progress and completion rates showcase how far learners advance in a course and whether they actually finish.
As an analytic, progress and completion are all about trends. The goal is to understand how many learners cross the finish line. And if learners aren’t finishing, these metrics can help you identify where learners are getting stuck in the course and hopefully determine the reason for abandonment.
Common course progress and completion metrics:
- Lesson, module, and course completion rates – This data reflects the number of learners who complete a course or a section of it, and is most often represented as a percentage.
- Drop-off/abandonment points – Not to be confused with abandonment rates, which is a percentage of learners who do not complete a course, abandonment points more qualitative in nature. This data identifies the point in which a learner stops all engagement.
- Assessment scores – These can be used to measure knowledge retention. However, in the case of engagement, assessment scores are used as a touch point that measures how far a learner has progressed. In this context, what matters more is that the assessment was completed, not the score itself.
Here are two real world examples of how companies turned metrics into meaningful analytics.
Operations Director at Rhino Rank , Jack Johnson, is a corporate training specialist with several years of experience. In one case, he noticed a consistent drop-off “at the same stage of a compliance module…” Recognizing that drop-off is often about the content itself and rarely about learner investment, he revised the course content. “Once we chopped the content into smaller, interactive bits, the completion rates increased by 35% in three months.”
Looking at the hiring industry, Lucas Botzen, CEO of Rivermate, broadened the scope of traditional progress and completion metrics, turning to demographic data too. “…when rolling out a global compliance training program to over 3,000 employees, we noticed from the LMS that completions flattened at 62%,” but only for specific regions, he says. After investigating further, he realized that language accessibility was the cause for the observed drop-off trend. “We deployed localized content rapidly and achieved completion rates of 92% within four weeks…”
- Knowledge assessment and retention
Knowledge assessment and retention metrics are quantifiable measures of how much a learner retains and/or understands.
As analytics, knowledge assessments and retention help you understand how effective your educational content is at teaching and how invested learners are in the product.
Common knowledge assessment and retention metrics:
- Assessment scores – These can be used to measure engagement by tracking how far a learner has progressed. However, in this context, assessment scores aim to measure understanding and retention.
- Assessment and question attempts: Like scores, attempts can also help you gauge engagement. They also help you understand whether learners understand and retain information upon first exposure.
- Pre-test and test scores: This data allows you to quantify learning progress over time and measure the impact of your product.
- Post-training surveys: Surveys allow you to collect qualitative feedback on the overall learning experience of your product.
The conclusions you draw from these analytics largely depend on two things:
- The kind of data you analyze: qualitative or quantitative
- The structure of your learning experience.
For example, assessment scores on a free response quiz will likely give you more insight into knowledge retention than a multiple choice question. By nature, a 4-choice multiple choice question gives learners a 25% of getting a correct answer.
Similarly, the way assessments are administered significantly impacts the data. An employee taking a quiz while accessing Google and notes will likely require far fewer attempts while also scoring higher than an employee in a lock-down browser or controlled testing environment.
Every assessment scenario is unique, so you’ll want to make you consider your unique setup when drawing conclusions from the data.
- Revenue and sales metrics
Revenue and sales metrics are key performance indicators (KPIs) that measure the effectiveness of sales initiatives.
As analytics, revenue and sales data connects learning product performance to business growth. These analytics help you understand the relationship between product and profitability. Perhaps even more importantly, these analytics help you identify areas for improvement.
Common revenue and sales metrics:
- Revenue by cohort/group: This is the cumulative revenue generated by a cohort or group.
- Revenue by product line: This is the cumulative revenue generated by a specific learning product or specific group of products.
- Average order value (AOV): This is the total revenue generated divided by the total number of orders over a specific time period and product/product type.
- Upsell and cross-sell rates: This data represents the number of successful attempts to get customers to purchase higher ticket or complementary learning products.
- Return on investment (ROI): Customer education ROI represents the benefit a customer receives from your learning product. ROI may represent both financial and nonfinancial benefits, such as an increase in sales conversion (financial) or a decrease in employee churn (nonfinancial). Here’s an ROI calculator we built to help you calculate this metric.
- Conversion rates by traffic source: This data measures the effectiveness of traffic sources by tracking desired outcomes like conversion.
Revenue by cohort and product line, average order value, upsell rates, and even conversion rate by traffic source are typically used by and for your business. These metrics help you understand how your business drives revenue and how it can improve. ROI, however, is a different story.
ROI is a metric that’s largely significant for training businesses and other B2B organizations like yours. This is because businesses like this aren’t selling directly to a learner, they’re selling to a CEO, an exec, a board of directors, or other stakeholders. And they must prove that the learning product is generating meaningful results for the purchasing company.
The CEO of Rivermate, Lucas Botzen, understands this perfectly. “ROI is always on our minds, and LMS analytics allow us to do exactly that.” His business compared mid-training quiz scores with post-training scores for one of his leadership development programs. He found that employees with an 85% or higher rating in his program had consistently higher team retention and productivity rates.
“Sharing this information with executives, I was able to advocate for increasing the program and obtaining a larger budget,” he says. “Instead of simply saying ‘X number of employees trained,’ perhaps I can demonstrate that the program led to lower turnover, higher productivity, and improved employee attitudes, each of which directly related to business outcomes.”
- Cohort or group-based metrics
Cohort or group-based metrics are generally the same metrics you’ll find above sections. We’ll explain why in a moment. But what’s important is how the analytics may differ from other use-cases where the same metrics are used.
Common cohort or group-based metrics
- Lesson, module, and course completion rates – This data reflects the number of learners who complete a course or a section of it, and is most often represented as a percentage.
- Number of discussion posts – This is the measure of posts in a given discussion board, chatroom, forum, or similar communication channel.
- Post likes, comments, and engagements – These are the sum of engagement types, most often measured per learning product or per cohort.
Unlike individual learner analytics, cohort analytics give you a big-picture view of how groups perform relative to each other. This perspective is especially valuable when you’re reporting back to B2B clients and their stakeholders.
Your job isn’t just to refine course design, it’s to help clients answer: “Is my group getting value from this training?”
By benchmarking one group’s performance against another, you can highlight trends, identify outliers, and give decision-makers confidence that their investment is paying off.
Let’s say Groups 1, 2, and 3 all purchased the same sales training program. Each group completes the course at an average rate of 88%. When Group 4 rolls out the program, their completion rate lands right in line at 87%. That consistency tells you and your client that the course delivers a stable, repeatable learning experience.
But let’s say you also find that Group 4 logged significantly fewer discussion posts and comments. That difference may signal a lack of team engagement, cultural barriers to peer learning, or a need for stronger facilitation. Sharing that insight with your client turns a single completion percentage into a clear action plan for improvement.
- Support & satisfaction signals
Support and satisfaction LMS metrics measure two things:
- How happy customers are with your learning product.
- How often they need help with your learning product.
Support and satisfaction as analytics help you understand how these two things are related and what they mean for your business success.
Common support and satisfaction metrics:
- Net promoter score (NPS): This metric measures how likely a customer is to recommend your product to someone else.
- Customer satisfaction score (CSAT): This metric results from asking customers to rate their satisfaction with your offering.
- Ratings and reviews: These are most often qualitative data that reflect customer experience and overall satisfaction.
- Support ticket volume: This represents the number of cases opened with your support team.
- Support ticket resolution time: This represents the length of time a support ticket is open. This can give insight into both the effectiveness of your support team and the complexity of customer problems.
- AI Assistant usage: The number of times learners and/or clients have engaged with a support bot.
Metrics like your NPS, CSAT, and reviews tell you how happy your customers are. Customer support metrics—support ticket volume, resolution time, and bot assistant usage—help you understand the bigger picture.
It’s possible to have happy customers and high ticket volume. In fact, that could even indicate your support tools and teams are well equipped to support your customers. However, if you find a negative correlation between these two metrics—meaning you have an increase in unhappy customers and high support utilization—you can leverage the data to identify opportunities for improvement.
For example, if CSAT and NPS scores dip while bot assistant usage spikes, that’s a red flag that learners are struggling. By reviewing the questions they ask most often, you can create better support resources and even refine your course content—like breaking up long modules or clarifying confusing sections—to address the root cause.
How to use LMS training reports to drive results
An LMS dashboard is the headquarters for your online learning platform. LMS dashboards are where you manage, track, and analyze data.
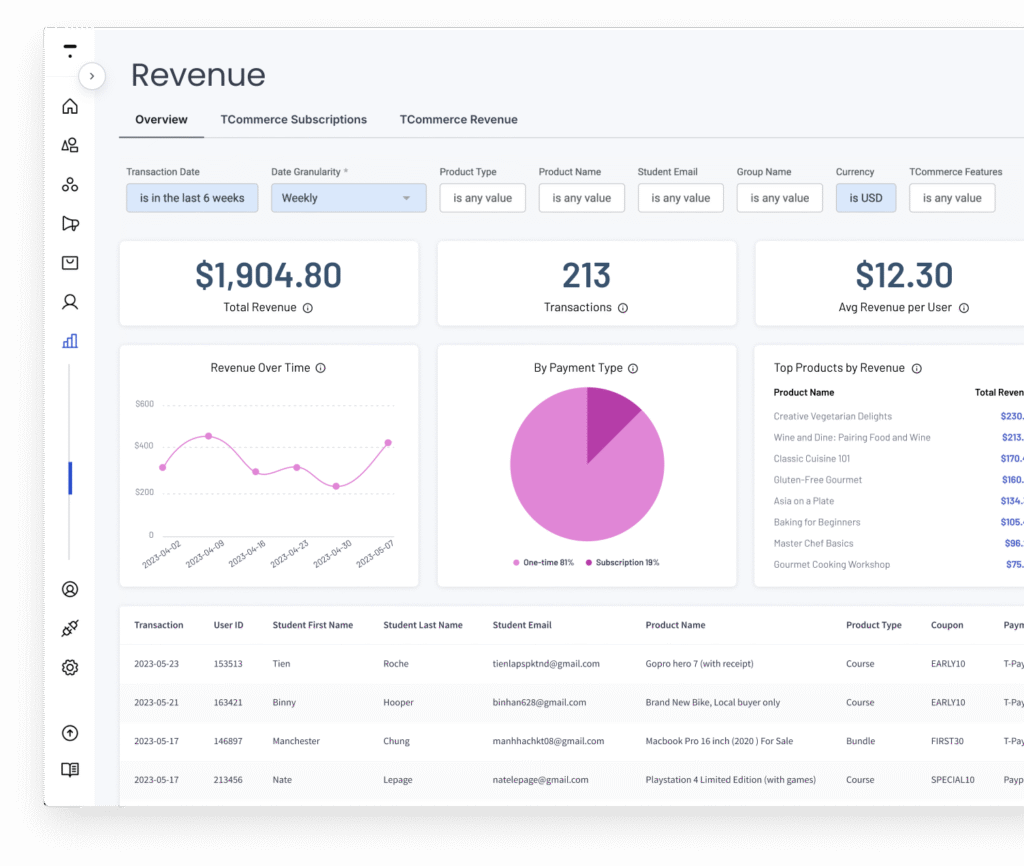
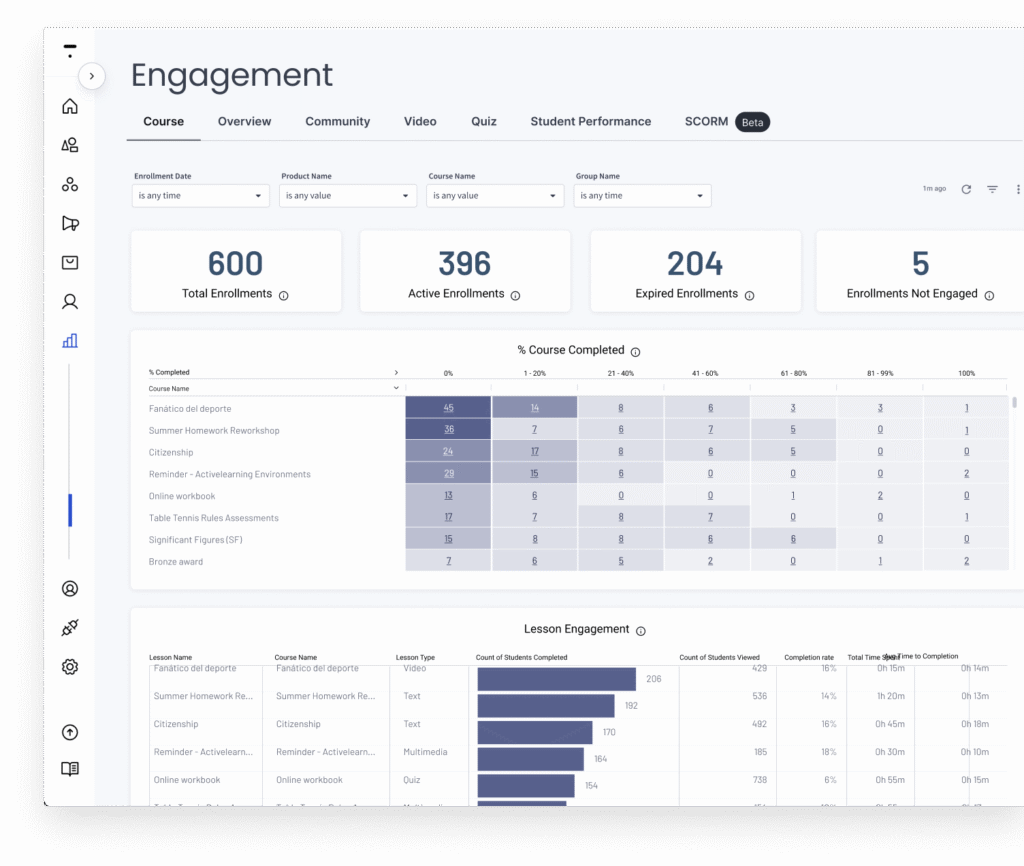
For example, Thinkific Analytics allows you to track and analyze revenue and engagement metrics (and more) in their own respective dashboards. Here’s what that looks like:
Having a robust but easy-to-use LMS dashboard is essential for two key reasons:
- Real-time visibility – A native LMS dashboard gathers and reports data in real time. This allows you to monitor for red flags (like when CSAT and NPS scores dropped in our last example) and pivot quickly.
- Non-technical empowerment – LMS dashboards simply complex data, highlight what matters most, and enable faster decision-making. This allows your customer success managers and content designers to do what they do best, in less time.
Final thoughts: make your LMS data work for you
LMS data should work for you, not make your job harder, which means having access to the right dashboards is critical.
In summary, LMS analytics can help you:
- Optimize learning experiences
- Prove ROI to clients and key stakeholders
- Guide future decisions, both internally and amongst clients
Thinkific’s analytics feature boasts a wide variety of dashboards, so you can track any and every metric you need. Thinkific’s dashboards include:
- Marketing dashboards: Track website and landing page trends, upsell and cross-selling performance, lead generation, and more.
- Course enrollments dashboard: Track enrollments over time, assess community and membership-base health, and more.
- Orders dashboard: Track orders, sales, and purchaser data, like referral sources.
- Revenue dashboard: Track revenue over time, by product, payment type and more.
- Engagement dashboards: Track how individual learners and groups engage with your content, course completion, video views, and more.
- Custom dashboards: Filter and segment data to curate training reports that focus on what matters most for your business. Or, take it one step further and curate dashboards that generate reports for your training clients, helping you to communicate with clients and stakeholders faster and with data they care about.
Want to see Thinkific Analytics in action? Book a demo of Thinkific Plus with one of our solutions experts. We’ll help you determine if Thinkific is right for you. If not, we’ll help point you in the right direction.