
TL;DR
When comparing Thinkific and Kajabi, the key question is how deeply you need to understand the impact of your learning programs.
- Thinkific is built for organizations that treat education as part of their growth strategy. It connects revenue, enrollments, learner engagement, funnels, and community activity in one place, with Advanced Analytics available for custom dashboards, role-based access, and automated reporting as programs expand.
- Kajabi, on the other hand, focuses heavily on marketing and sales analytics. Its dashboards highlight offers, subscriptions, funnel performance, and revenue trends, which work well for creators who prioritize acquisition and sales visibility.
Both platforms offer analytics, but they serve different priorities: Kajabi emphasizes marketing performance, while Thinkific is designed to help teams understand how learning drives business results.
Introduction
Education has become a powerful lever for growth, but not every business uses it in the same way. For some, education is the product. For others, it supports customer adoption, partner enablement, compliance, or retention. In many cases, it does all three.
As education plays a larger role in how businesses grow and scale, the tools behind it matter more. Platforms that once focused primarily on marketing or content delivery now need to support analytics, reporting, and decision-making across the full learning journey. That’s where comparisons between platforms like Thinkific and Kajabi often begin.
This article offers a practical comparison of Thinkific and Kajabi, with a specific focus on analytics and ROI. Rather than just listing features, it looks at how each platform supports real-world use cases, from selling courses to running customer education or training programs that drive measurable business outcomes.
Whether education is central to your business or part of a broader growth strategy, the goal is the same. You need visibility into performance, confidence in your data, and insights to decide what to do next. This blog post is designed to help you determine which platform best supports that approach.
Skip ahead:
- Outcome 1: Proving ROI and business impact
- Outcome 2: Understanding learner engagement and success
- Outcome 3: Understanding what drives growth and conversions
- Outcome 4: Creating custom dashboards for personalized situations
- Outcome 5: Enabling the right people to access the right insights
Outcome 1: Proving ROI and business impact
As education takes on a larger role in how organizations grow, proving ROI becomes essential. Leaders want to understand not just how much revenue education generates, but how learning influences adoption, retention, performance, and long-term outcomes.
Strong analytics make it possible to connect learning activity to business results. Without that connection, education often gets evaluated on surface-level metrics that don’t reflect its true impact.
Thinkific strengths and limitations
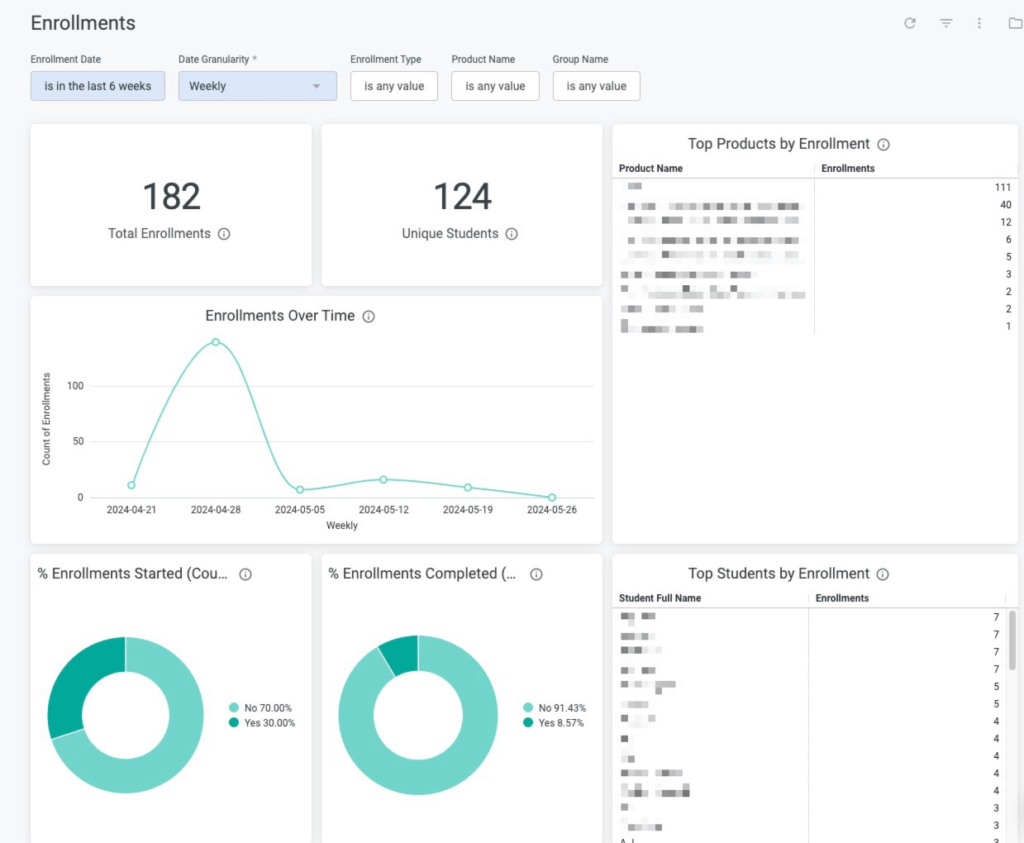
Thinkific Analytics is designed to help teams understand how learning activity and business performance connect.
With Thinkific Analytics, teams can:
- Identify products with strong enrollment but low engagement. This helps teams pinpoint where content, pacing, or structure may need improvement.
- Understand how different offerings, such as courses, bundles, memberships, and communities, affect overall active user participation across the platform.
- Evaluate how new content launches or GTM initiatives influence trial conversions and long-term customer value. This makes it easier to assess the impact of growth strategies.
- Track how learner progress and completion correlate with revenue and retention signals. This helps teams demonstrate the business impact of education programs to leadership and stakeholders.
- Spot trends across cohorts and time periods, so the team can understand how participation evolves as programs scale.
Note: Thinkific Analytics is not designed to replace an ERP or full financial system.
The reporting focuses on the learning, enrollment, and revenue data generated within the platform, so organizations that require cross-system financial reconciliation or accounting-level analysis may need to integrate Thinkific data with external finance or ERP tools.
Kajabi strengths and limitations
Kajabi gives you clear visibility into revenue and subscription performance, especially if your main focus is selling digital products through funnels.
Kajabi helps your team:
- Understand which marketing efforts generate traffic and purchases, with analytics that connect page views, opt-ins, and offers to sales activity.
- Track revenue performance across offers and pricing models, so they can see how different products, payment plans, or promotions contribute to overall income.
- Monitor subscription health, including new subscriptions, churn, retention, and recurring revenue trends tied to specific offers.
- Identify audience and contact growth patterns, showing how opt-ins, new contacts, and top customers expand your marketing reach and influence revenue.
Limitations to keep in mind
- ROI is largely detached from learning outcomes: analytics focus on sales and subscriptions, not on how learner engagement or completion drives those results
- There is no deep connection between course progress and revenue in a single view, which makes it harder to tell a full impact story for training or B2B programs
- Custom or ad-hoc ROI reporting that ties learning performance to outcomes typically requires exporting data and combining it in external tools
| Takeaway For training companies, academies, and B2B programs, impact goes beyond revenue totals. Teams need visibility into engagement, completion, and outcomes.Thinkific supports this by connecting learning performance to business results, while Kajabi focuses primarily on sales and marketing metrics. This makes Kajabi less suited for organizations that need to demonstrate education impact beyond revenue. |
Outcome 2: Understanding learner engagement and success
To improve learning outcomes over time, teams need to understand not just what learners finished, but how they learned. Engagement data reveals:
- Where are learners staying engaged?
- Where do they slow down or drop off?
- How do assessments and activities support understanding?
Thinkific strengths and limitations
This is where the depth of Thinkific’s analytics is most apparent. Thinkific provides a complete view of learner behavior, making it easier to understand not only completion but engagement throughout the learning journey.
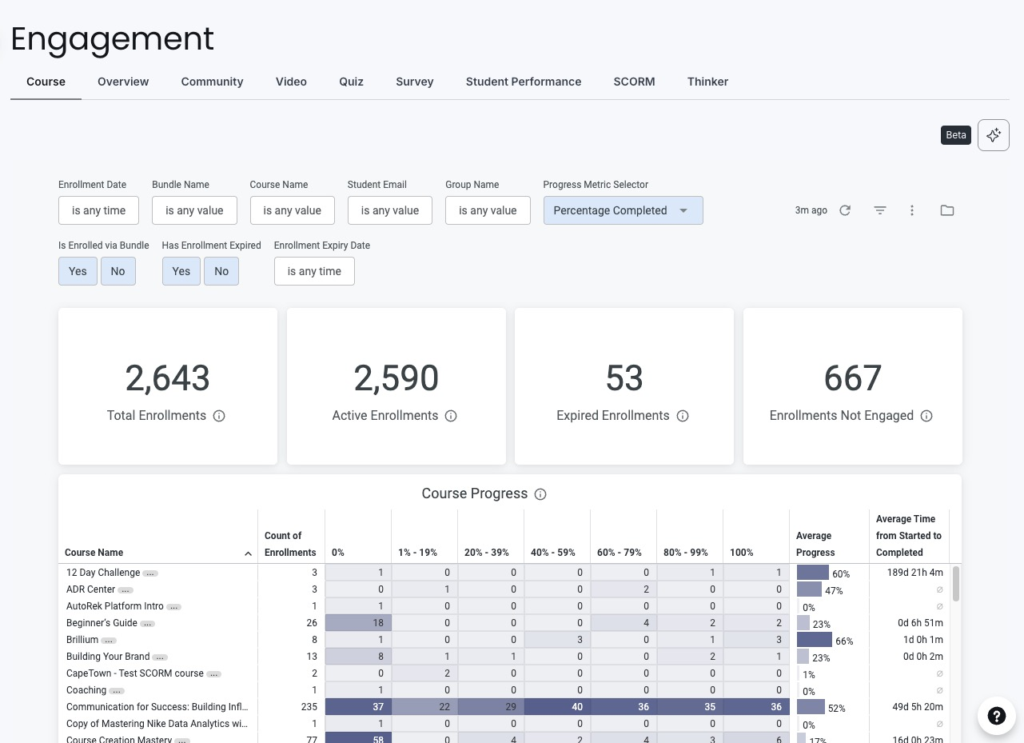
Teams can see:
- Lesson-level completion and progress, including where learners slow down or stop
- Time spent and last activity, to understand effort and momentum
- Quiz, survey, and assignment performance, highlighting what learners understand and where they struggle
- Video engagement insights, including plays and drop-off points
- Per-learner views across all products, helping identify high performers or learners who need support
- Community participation, surfacing discussion activity and cohort engagement
This depth allows teams to continuously refine content, improve learning paths, and support learners more effectively. It also makes it easier to report on learning success to leadership or external stakeholders.
That said, this level of insight requires teams to think intentionally about how they use the data. Thinkific prioritizes actionable visibility, but organizations still need to decide which engagement signals matter most for their goals.
| Why this matters: When engagement data is detailed and connected, teams can fix specific friction points instead of redesigning entire programs. |
Kajabi strengths and limitations
Kajabi keeps learning engagement metrics intentionally simple, which can work well if you mainly need to confirm whether learners finished your products.
What Kajabi does well
- Product Progress report: Shows whether customers have started, are in progress, or have completed a product
- Lesson and video visibility: Basic indicators of whether content has been viewed and how far learners have progressed
- Quiz and assessment scores: View quiz performance at a high level through course reports
- Straightforward progress view: Simple dashboards that make it easy to see “who is done” without extra configuration
Limitations to keep in mind
- No time-spent data or detailed interaction tracking to understand effort or where learners slow down
- Limited video analytics: There’s no granular drop-off curves or per-learner engagement history
- No learner-level view across products that shows how individual learners behave across your entire catalog
As a result, it’s harder to diagnose specific friction points, support at-risk learners proactively, or report deeply on learning effectiveness.
| Takeaway Kajabi is great for creators selling digital products who need simple delivery and basic engagement confirmation. But Thinkific gives training teams and education-led organizations the depth they need to design better learning experiences, improve outcomes, and confidently report on learner success. |
Outcome 3: Understanding what drives growth and conversions
Growth doesn’t happen by accident. To scale learning programs effectively, teams need to understand how interest turns into enrollment and which paths consistently lead to action.
Conversion insights help you see:
- Where learners come from
- What motivates them to enroll, and
- Where friction slows growth
This information helps teams strengthen acquisition without guessing or over-investing in the wrong channels.
Thinkific strengths and limitations
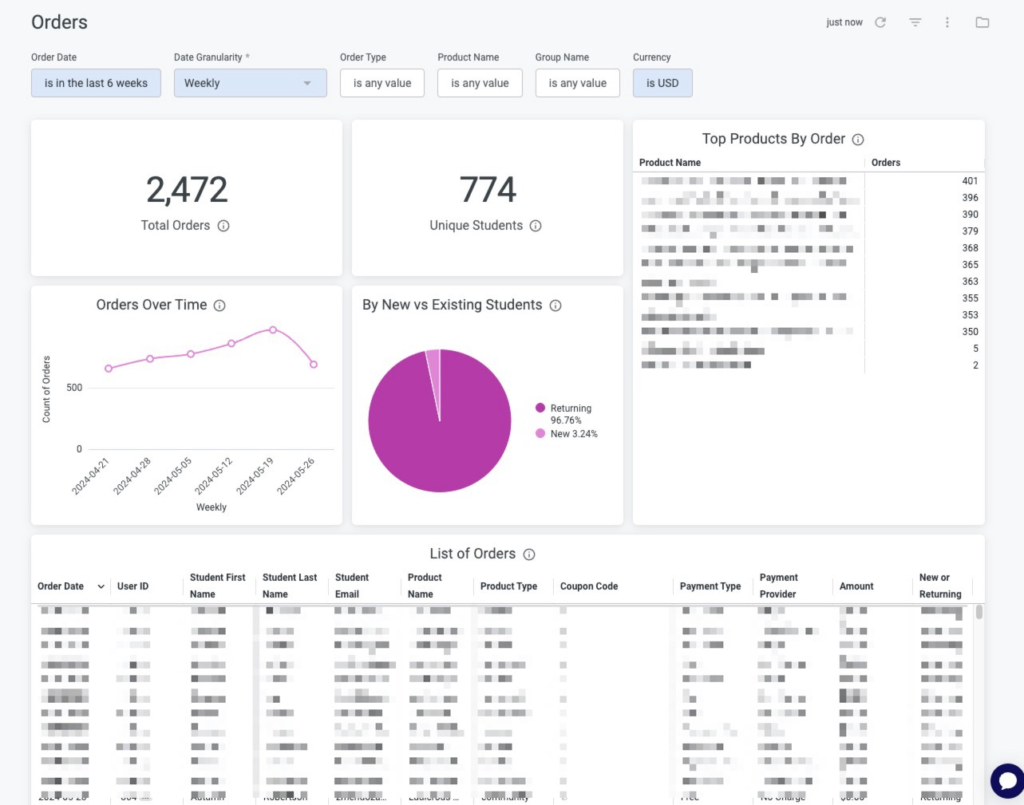
Thinkific Analytics provides visibility into how learners move from discovery to enrollment, helping teams understand which offers and entry points drive growth.
Teams can see:
- Visitor-to-checkout behavior, showing where prospects engage or drop off
- Landing page and lead magnet activity, revealing which assets attract qualified interest
- Checkout success and failure insights, helping identify friction at the point of purchase
- Revenue breakdown by product, making it easier to see which courses, bundles, or memberships convert best
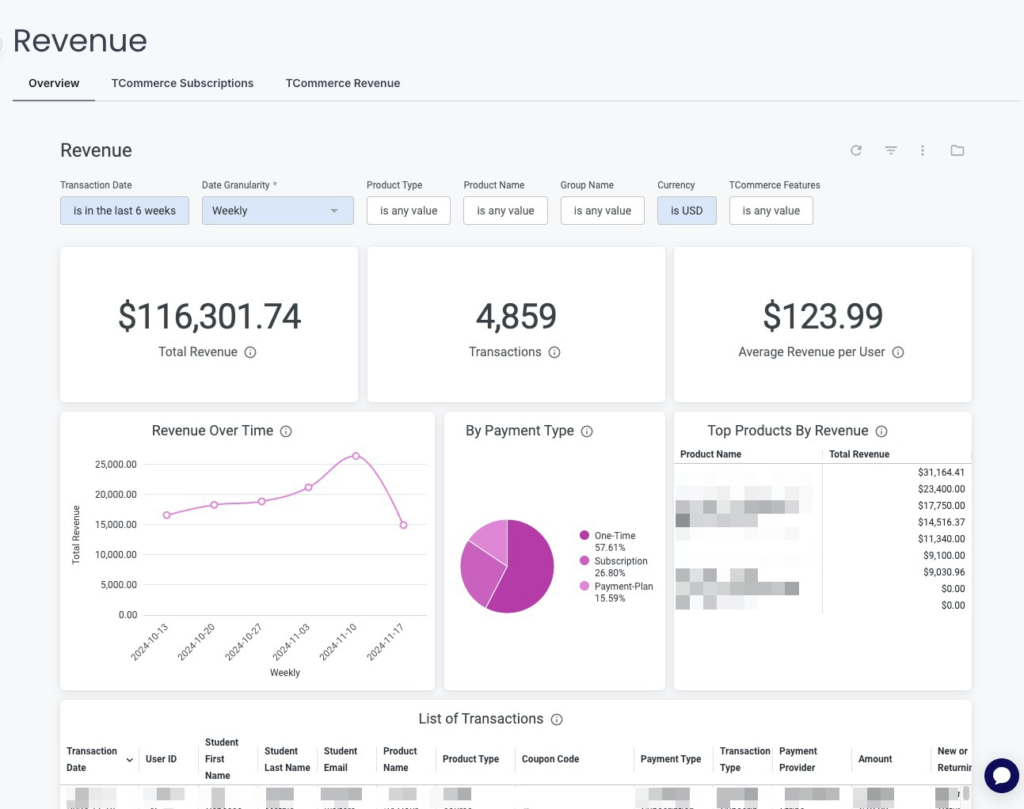
These insights help teams connect growth signals to learning performance and longer-term retention, rather than viewing conversion as a one-time event.
However, if your team needs deep campaign-level marketing analytics, they may need to integrate with external tools, as Thinkific prioritizes learning-centric growth visibility over full marketing automation.
Kajabi strengths and limitations
Kajabi is strong on marketing and funnel analytics, especially if acquisition and sales are your primary focus.
With Kajabi, you get:
- Real-time dashboards for opt-ins, offers, page views, subscriptions, and revenue trends
- Page analytics that show views, opt-ins, and conversion rates for individual pages and landing pages
- Campaign and funnel visibility through metrics for cart orders over time, offer purchases, and payments by offer
- Flexible date range filtering so you can analyze performance daily, weekly, monthly, or over any custom period
Limitations to keep in mind:
- Funnel insights are mostly isolated from learning data, so it is difficult to see how specific campaigns translate into long term engagement or completion
- There is no unified, in-platform view that blends funnel performance with learner outcomes, so teams must infer long-term value from sales alone
For advanced, education-led growth strategies, you will likely rely on external analytics tools plus exports to understand how conversions connect to retention and success.
| Takeaway Kajabi is a strong fit if your primary focus is acquisition and sales performance. But Thinkific is better suited for teams that want to understand how growth, learning, and retention connect, as it provides a clear picture of which conversion paths lead to sustained success. |
Outcome 4: Creating custom dashboards for personalized situations
Executives, instructors, operations teams, and B2B clients all care about different questions and need different views of performance.
Custom dashboards make it possible to tailor analytics to the situation. Instead of forcing every stakeholder to interpret the same report, teams can design views that surface exactly what matters for each role, decision, or audience.
This is especially important for organizations running multiple programs, serving different customer segments, or supporting B2B and enterprise clients.
Thinkific strengths and limitations
Thinkific supports more advanced customization through Advanced Analytics, allowing teams to design dashboards that reflect how their organization actually operates.
With custom dashboards, teams can:
- Combine revenue, engagement, and growth data into a single, unified view
- Filter by cohort, timeframe, segment, or product, depending on the question at hand
- Create role-specific dashboards, such as executive summaries, instructor views, or account-level reporting for B2B clients
- Define custom KPIs and comparisons, aligned to internal goals or contractual requirements
This flexibility helps teams move beyond one-size-fits-all reporting and support more sophisticated use cases, including enterprise training, client reporting, and multi-program academies.
The tradeoff is that this level of customization requires more intentional setup. Teams need to decide what they want to measure and how different stakeholders should consume data.
Kajabi strengths and limitations
Kajabi analytics dashboards are designed to be straightforward and largely fixed, with limited customization compared to Thinkific.
This simplicity reduces setup time but also means teams have fewer options to tailor dashboards or reporting views to different roles, questions, or programs.
With Kajabi, you get:
- A prebuilt overview dashboard that highlights key business metrics at a glance
- The ability to customize the overview layout by choosing widgets, rearranging them, and removing what you do not need
- Filters for time range and comparison period, allowing you to adjust the context of your main analytics view
- A catalog of detailed reports, such as revenue, subscriptions, contacts, page views, and product progress, that you can open as needed for deeper detail
Limitations to keep in mind:
- Limited dashboard customization beyond the overview widget arrangement
- No way to blend learning, revenue, and marketing data into one unified, role-specific dashboard
- Filtering options are more constrained than a dedicated BI-style layer, which makes it harder to adapt reporting to different roles, such as executives, instructors, or B2B clients, or to more complex scenarios
| Takeaway Thinkific supports deeper, more customizable and sophisticated reporting needs, especially for organizations operating at scale or supporting B2B and enterprise use cases.Kajabi is a strong choice if you want simple, fixed dashboards that don’t need advanced customization or role-specific views. |
Outcome 5: Enabling the right people to access the right insights
As education programs grow, more stakeholders need visibility into performance. Leaders may want high-level summaries, instructors need learner progress, operations teams track program health, and sometimes entire client organizations need insight into their learners.
For admins, the challenge is giving each group access to the insights they need without exposing sensitive data or granting access to settings they shouldn’t manage. Strong analytics and reporting should make it easy to share the right information with the right people while keeping roles and permissions clearly defined.
Thinkific strengths and limitations
Thinkific is designed to support collaboration at scale. It allows multiple roles to work with analytics while keeping data access intentional and secure.
Teams can:
- Support multiple roles, including site admins, course admins, and group analysts, so teams can collaborate without exposing irrelevant or sensitive data
- Use role-based access, ensuring instructors, internal teams, and external B2B clients only see the insights that matter to them
- Automate report delivery, with scheduled reporting via email, webhook, S3, or SFTP, eliminating manual exports and data pulls
- Share insights without requiring platform access. Thinkific’s scheduling feature allows external teams or clients to access insights without logging in to the learning platform.
This makes Thinkific a strong fit for organizations that need to share analytics across teams or provide clients with regular progress updates. It keeps stakeholders informed while reducing the manual effort required to compile and distribute reports.
Kajabi strengths and limitations
Kajabi’s analytics model is oriented around the primary site owner or a small internal team managing performance centrally.
What Kajabi does well:
- Provides clear dashboards and reports that a single owner or small team can use to monitor sales, subscriptions, and basic product performance
- Supports exports of many reports, such as revenue, subscriptions, offers, and contacts, so teams can share CSV files or build external dashboards when needed
Limitations to keep in mind:
- No analytics-specific roles or granular permissions to give different stakeholders tailored access to analytics views
- No built-in, role-based dashboards for instructors, executives, account managers, or B2B clients
- No publicly highlighted scheduled analytics report delivery, which means keeping stakeholders updated often depends on manual exports or screenshots
- This approach works for solopreneurs and small teams, but can become limiting when you need to share analytics broadly and safely across internal teams or client organizations
| Takeaway If your learning programs involve multiple stakeholders or require regular reporting to internal teams or clients, Thinkific is built with that in mind.Kajabi works best for solo operators or small teams that don’t need to share data or manage analytics access across roles. |
Final recommendation
Choosing between Kajabi and Thinkific ultimately comes down to how education fits into your business and what you need analytics to support.
Both platforms offer visibility into performance, but they’re designed for different priorities and operating models.
Choose Thinkific if
- You want visibility across revenue, engagement, funnels, and community in one place
- You need to prove ROI and business impact, not just track sales
- You work with internal teams or B2B clients and need to share tailored insights
- You require custom dashboards, granular permissions, and automated reporting as your programs scale
Thinkific is built for teams that treat analytics as part of their operating infrastructure, not an afterthought.
Choose Kajabi if
- You prioritize marketing and funnel analytics
- You want a strong UI with simple, out-of-the-box reporting
- You don’t need deep learning analytics, custom dashboards, or role-based access
Kajabi works well for businesses where education is closely tied to marketing performance and sales execution.
Final takeaway
Thinkific is best suited for organizations that treat education as a strategic growth lever and analytics as a business intelligence layer that connects learning, revenue, and long-term outcomes.
Kajabi is a better fit for sales-focused creators who care most about marketing performance and straightforward revenue reporting.
Both platforms can support growth. The right choice depends on whether you need analytics to explain what sold or what worked.
Ready to choose the right analytics foundation?
If you’re ready to move beyond surface-level reporting and start tracking the metrics that drive learning outcomes and business impact, Thinkific can help.
- Start a free 30-day Thinkific trial to explore analytics and reporting firsthand
- Book a call with our team if you need support for multi-team, B2B, or enterprise learning programs.