
Customer success benchmarks for SaaS and B2B companies help businesses compare their performance to industry standards and maintain alignment with customer needs, improving customer satisfaction and retention.
In this, we’ll dive into key customer success benchmarks like CLV, CSAT, and churn rate, show you how to calculate them, discuss strategies for improving retention, and share some of our favorite tools for tracking customer success. Let’s get started!
Skip Ahead:
- Introduction to customer success benchmarks
- Understanding churn rates and their impact
- Key metrics for measuring customer success
- Strategies for improving customer retention
- Top tools for tracking customer success
- Conclusion
Introduction to Customer Success Benchmarks
Customer success refers to the process through which businesses ensure customers derive value from their product or service, ultimately impacting the customer’s loyalty to the brand. Customer success in SaaS and B2B businesses is paramount to your business’ success—satisfied customers are more likely to purchase more and deliver referrals.
So, for a process as important as customer success, how is it measured? Enter customer success metrics. These key performance indicators (KPIs) help you identify which parts of your process are working and which elements need improvement.
Metrics like customer lifetime value (CLV), net promoter score (NPS), and customer satisfaction (CSAT) provide valuable insights into your customer success strategy by allowing you to isolate, analyze, and improve specific components of your customer’s experience.
Following customer success metrics are customer success benchmarks—”benchmark” being the key differentiating factor. When referring to metrics and benchmarks, you typically refer to the same values, CLV, NPS, and CSAT, in this case. However, metrics are data collected from your business, while benchmarks are the current industry standard for that same metric.
Benchmarks are important because they allow you to compare your business’s performance to the average company in your industry. For example, according to Recurly Research, the average churn rate for a B2B company is 4.91%, lower than the 6.77% for B2C companies. So, a B2B business with a churn rate of 6% knows there’s an opportunity for improvement because it sees a much higher churn rate than the industry average.
Understanding churn rates and their impact
Churn rate is one of the most important customer success metrics because it can help you understand the true efficacy of your customer success process.
The churn rate refers to the number of customers you’ve lost in a specified period and is represented in a percentage. To calculate your churn rate, follow the formula below:
Churn rate (%) = ( Lost customers (at the end of specified timeframe) / Total customers (at the start of the specified timeframe) ) * 100
A simple Google search of the “churn rate formula” will yield different results. One common difference is the representation of the churn rate—whether in decimal or percentage form. Our formula yields a percentage for easier interpretation.
Another notable variation includes growth (new customers acquired) in the calculation. However, incorporating growth can skew your understanding of the actual churn rate. Here’s an example:
( 10 lost customers / 100 customers ) * 100 = 10%
Now, with growth included:
(10 lost customers – 5 new customers / 100 customers) * 100 = 5%
In both equations, the amount of lost customers remains unchanged, yet the final rate changes significantly. The second formula underestimates the severity of customer churn, which may cause teams to miss underlying issues with the customer success process. So, as you calculate customer churn and conduct a churn rate analysis, ensure the formula you use yields the specific results you’re looking for.
Average churn rates by industry
| Industry | Churn rate (source) |
|---|---|
| Average SaaS churn rate | 3% – 14% (Fullview & Cobloom) |
| Average technology and IT services churn rate | 12% (CustomerGauge) |
| Average telecommunications churn rate | 31% (CustomerGauge) |
| Average financial services churn rate | 19% (CustomerGauge) |
| Average e-commerce platform churn rate (non-subscription) | 70% – 80% (Sellzone) |
| Average e-commerce platform churn rate (subscription) | 5.57% (Sellzone) |
One thing to keep in mind as you gather churn benchmarks for your industry, it’s important to use stage-appropriate rates.
Here’s what Kevin Nakao, the Managing Director at REVgtm, says:
“A company with less than $5 million in Annual Recurring Revenue (ARR) is still trying to achieve product-market fit, whereas a larger, scaled company has not only achieved this milestone but has started to encounter the law of large numbers.
Paddle, which provides billing and payment infrastructure for SaaS companies and collaborates with VCs like Openview for portfolio data access, illustrates this point. Their data shows that companies with less than $1 million in ARR have a Gross Retention Rate of 84%, compared to 89% for those with over $50 million in ARR.”
So, as you compare your business’ performance to others in your industry, aim to get as niche as possible.
Next, let’s look at additional customer success metrics to follow.
Key metrics for measuring customer success
In addition to churn rate, there are several SaaS customer success metrics metrics many B2B and SaaS companies track. Let’s define three of the most important metrics and explain their significance.
Customer satisfaction
Customer satisfaction (CSAT) is the metric that measures how well your product or service meets or exceeds customer expectations.
This metric is typically measured using quantitative surveys. Respondents are asked to rate their satisfaction with your business on a scale of one to five (highly unsatisfied to highly satisfied).
Then, to calculate your CSAT, you simply divide the number of satisfied and highly satisfied respondents by the total number of respondents who took the survey and multiply by 100 to get a percentage.
CSAT = (Number of satisfied respondents (rating 4 or 5) / Total number of respondents ) * 100
CSAT directly impacts:
- Customer retention rates
- Insights into the overall customer experience
- Understanding of alignment with customer needs
Overall, your CSAT metric aims to understand how happy and likely your customers are to continue using your product. If customers are unhappy, the CSAT acts as a warning signal telling you to investigate where the business is misaligned with the customer’s needs.
Net promoter score
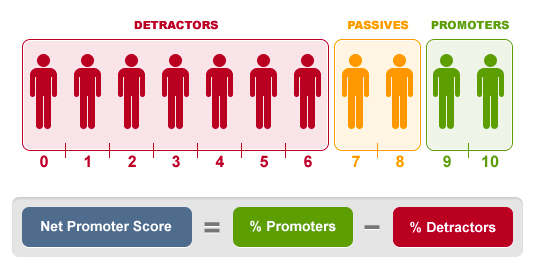
The net promoter score (NPS) is a metric that allows companies to measure customer satisfaction and the likelihood that customers will refer their product or service to others.
To gather data for your NPS score, ask one simple question on your next survey: How likely are you to recommend our product or service to a friend, family member, or colleague?
Respondents then rate on a scale from zero to 10 (highly unlikely to highly likely). Respondents who replied between zero and six are considered “detractors,” those scoring seven or eight are “passives,” and respondents scoring nine and 10 are labeled “promoters.”
To calculate your NPS, take the percentage of detractors and subtract the percentage of promoters.
“In the B2B sector—where word-of-mouth is critical and reputational excellence is king—understanding NPS leads us to brand advocacy…”
– Derek Bruce, the Operations Director for First Aid at Work,
So, not only are highly satisfied customers more likely to continue purchasing from you, but they’re also more likely to drive referral traffic. Both of these are low-cost revenue sources compared to the acquisition of new customers, making NPS a highly valuable metric for understanding the future potential for revenue and the customer experience.
Customer lifetime value
Customer lifetime value (CLV) measures the customer’s total revenue value over the lifespan of their relationship with your business.
The CLV metric is so valuable to customer success because it indicates the total monetary worth of a customer throughout their relationship with your business.
The formula for calculating CLV is the most complex of the three customer success metrics featured in this section. Start by multiplying the average purchase value by the average number of purchases a customer makes in a given timeframe. The result of this calculation will be your customer value.
Next, multiply your customer value by your average customer lifespan, which is the average number of years customers remain active divided by the total number of customers.
The final equation will look like this:
IMAGE: CLV = Customer value x Average customer lifespan
Consider factoring in customer acquisition costs (CAC) and operational expenses for a more precise CLV.
“This [CLV] is not only a measurement of customer health but also can provide you guidance on how much you should spend to acquire a customer. If you have a good customer retention rate (+90%), you can make the business case to acquire customers for their future value and revenue.”
–Kevin Nakao, Managing Director at REVgtm
Ideally, all internal teams, including customer success and customer support, are working to increase the revenue generated per customer in a given time frame and the average customer lifespan. You can accomplish this by improving customer satisfaction and loyalty.
Derek summarizes how the three metrics featured here work together to inform the customer success process:
“Grasping these metrics collectively—NPS and CSAT scores alongside CLV—not only directs us to our strengths but also reveals enhancement opportunities,” he says.
“High NPS and CSAT scores indicate robust customer relationships, often leading to increased CLV; thus, by diligently enhancing these indicators, we commit not merely to immediate profits but to nurturing a resilient client base that genuinely values and trusts… for the long term.”
Strategies for improving customer retention
Maintaining a strong customer relationship is just as, if not more, important than bringing in new customers. Again, improving customer retention is cheaper than acquiring new customers and often easier—they’ve already committed to your business once.
Here are three proven customer success strategies to help you boost customer retention.
Personalized customer experiences
A personalized customer experience makes customers feel valued and appreciated. Personalizing their experience can be as easy as using their name or as complicated as deploying predictive analytics to anticipate their unique needs.
Regardless of how you decide to personalize the experience, personalizing your product or service is an excellent way to boost loyalty and meet B2B customer retention benchmarks.
Proactive customer success management
Anticipating your customers’ needs before those needs are expressed can go a long way in increasing customer retention. Foster proactive customer success management by ensuring your support teams are trained accordingly, empowered to act in the customer’s best interest, and well-equipped with the tools and resources they need to support your customers.
Here are some additional proactive customer success strategies to consider:
- Regular check-ins encourage you to check with your customers about their progress and success before issues even arise. Ultimately, the goal is to predict and resolve any problems before they escalate.
- Predictive analytics can help teams foresee customer concerns, like regular check-ins, before they occur, allowing you to address them before the customer experiences significant issues.
- Customer education, like online learning management systems and online courses, gives customers the tools and resources they need to derive value from your product without significant hands-on support.
Utilizing customer feedback effectively
Solicited feedback, like customer surveys, is a common method to gather insights on the customer experience. In addition to solicited feedback, consider methods like social listening, where you monitor social media and online review platforms for feedback that may not be submitted to you directly.
Both solicited and unsolicited feedback are great ways to understand how satisfied your customers are with your product or service and assess opportunities for improvement. But what’s most important about the feedback you gather is that you address it.
Analyze your feedback for common themes and trends, and then devise an action plan for addressing those feedback trends promptly. Once you’ve made the necessary changes, share them with your customers. In addition to appreciating the changes, demonstrating that you’ve received and acted upon customer feedback will make them feel valued and drive stronger customer satisfaction and loyalty.
Now, with a strong understanding of customer success benchmarks and customer success strategies, let’s turn to tools for tracking customer success.
Top tools for tracking customer success
Investing in the right tools for tracking customer success can save you time and money by streamlining the tracking process, making analysis easier and helping to avoid errors. Below are three of the tools we recommend for tracking customer success.
1. Thinkific Plus
Thinkific Plus is a customer education platform designed to support all customer success strategies. This platform leverages customer education to boost key customer success benchmarks like engagement and retention.
Easy to use for both customers and your customer success team, Thinkific Plus’ key features include a dedicated customer success team, unique environments for supporting users across multiple sites, advanced customization for branded experiences, and unlimited admins.
2. Tidio
In contrast to Thinkific Plus, the Tidio platform is designed to support your customer support process rather than help educate, onboard, or train customers. It primarily functions to connect you with your customers through various channels.
The Tidio platform features an AI-powered live chat, chatbot builders, Shopify order management, advanced ticket tracking, native analytics tracking, and more.
3. Front
Front is a customer communication platform that streamlines correspondence between your customers and your customer success team. It creates a centralized location for all internal and external communication channels, including text, email, social media, and more.
Users can attach and assign tasks to messages, communicate with each other, and manage all communication from Front. Its features include message tagging, collaborative response drafting, efficiency analytics, workflow automation, and integrations with other common industry tools.
Set your customers up for success.
The best way to keep your customers happy is to make sure they’re getting the results they want from your product or service. That takes knowledge, and a Customer Training LMS Software is the only way to build that knowledge effectively at scale.
A Customer Training LMS Software will help you retain customers by accurately tracking customer success metrics and helping you improve the customer success process. Learn more about how you can achieve this with Thinkific Plus.
Conclusion
Thank you for exploring customer success benchmarks for SaaS and B2B companies with us.
If you’re ready to take the next step and get personalized guidance to streamline your customer success strategies and improve your metrics with online learning, get pricing details, and a live demo of Thinkific Plus, don’t hesitate to reach out to our experts.
Request a call with a member of our Thinkific Plus solutions team today, and let us help you unlock the full potential of your online learning journey.