
Why proving impact, not producing more content, separates learning leaders from everyone else in 2026.
Ask almost any leader whether learning impacts their business, and the answer is yes. Ask them how they prove it, and the conversation gets more complicated.
According to Thinkific’s 2026 Industry Benchmarks Report, 98 percent of organizations say learning directly impacts sales, support, or revenue. Yet fewer than 1 in 3 can confidently quantify that impact. And 41 percent can’t connect their learning data to their CRM or business systems at all. Throughout this article, we’ll reference data from that report: a survey of 1,000+ professionals across customer success, training, product, marketing, and operations, to help you understand where the strongest programs are investing and where the biggest gaps remain.
In 2026, measurement is the gap that defines learning programs in 2026. Why? Belief is universal, yet Infrastructure is not. The organizations winning right now aren’t producing more courses or polishing more content. They’re getting better at proving what their learning programs already do, which is why measurement maturity has become the next competitive advantage.
Here’s why, and what to do about it.
Skip ahead:
- Why measurement became the bottleneck
- The Learning Revenue Chain
- Measurement: The strategic unlock
- Where most teams actually are
- Find your stage in 5 minutes
Why measurement became the bottleneck
Learning’s revenue contribution has quietly expanded far beyond direct course sales.
When asked which outcomes they most strongly associate with learning for Thinkific’s 2026 Industry Benchmarks Report, professionals with leading learning programs ranked customer retention (63 percent), expansion (62 percent), and faster onboarding (55 percent) ahead of direct course revenue (38 percent). More than half (58 percent) say learning influences over a quarter of total annual revenue. That’s a strategic shift. But measurement infrastructure hasn’t kept up.
Nearly half of organizations (47 percent) say reporting is slowed by time and resource constraints and around a third (32 percent) cite limited analytics expertise. Another 28 percent admit they don’t have clear KPIs tied to business outcomes in the first place. So, learning teams are sitting on programs that drive real revenue impact, and struggling to point at it in language the business understands.
This is why learning often stays under-invested even when it’s working. Without measurement, leaders can’t defend the budget, prioritize the next initiative, or earn the executive credibility that unlocks the next stage of growth. Enter:
The Learning Revenue Chain
To close that gap, Thinkific’s research for the 2026 Industry Benchmarks Report codified a strategic framework called the “Learning Revenue Chain.” The principle behind it is simple:
“Learning drives revenue only when it drives behavior. And behavior drives revenue only when it’s measured.”
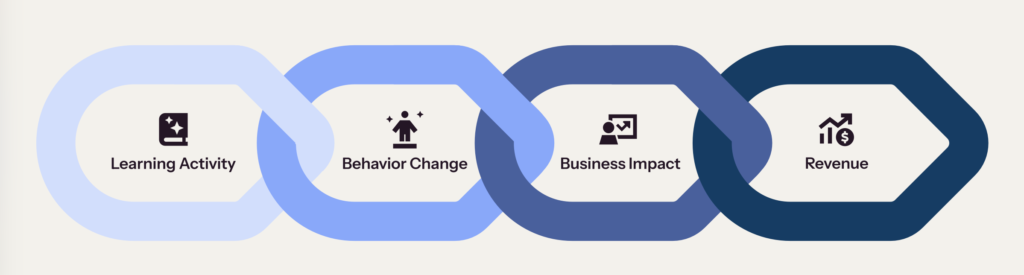
The chain has four visible links:
Learning Activity → Behavior Change → Business Outcomes → Revenue Impact.
Measurement runs through all of them as the connective tissue.
Each stage builds on the last. When any link is weak, revenue impact stalls. When all four are intentionally designed and connected, and measurement is built in from the start, learning becomes a predictable, scalable growth engine.
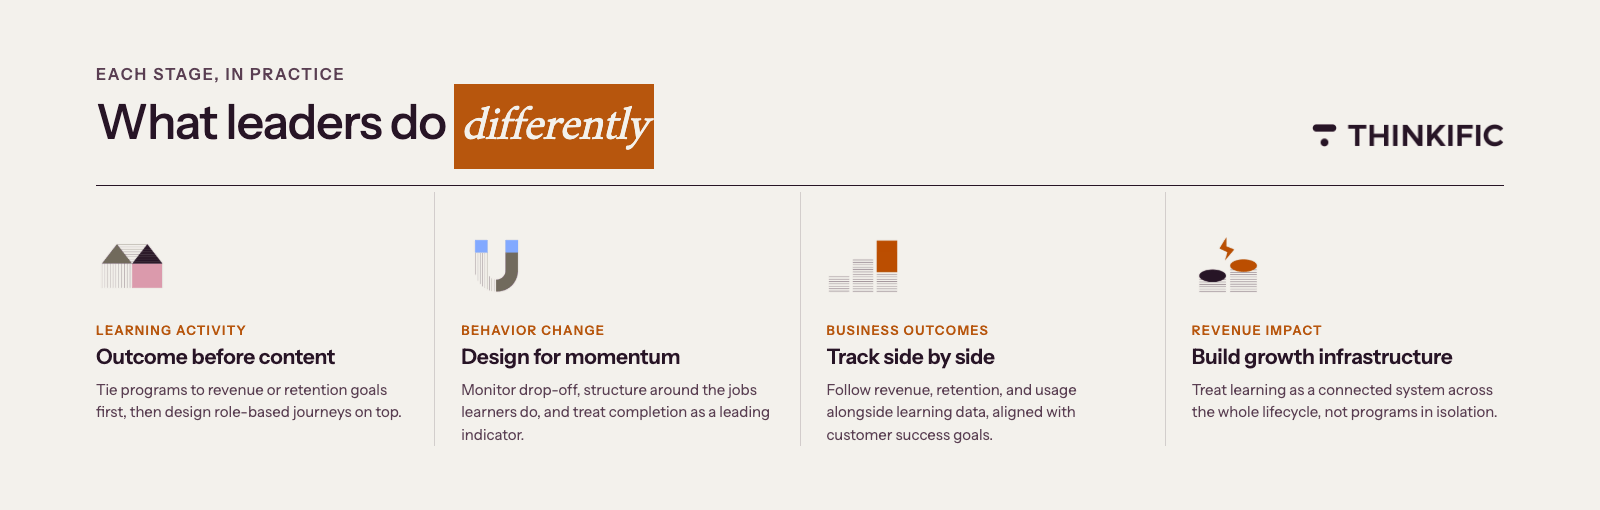
Here’s what each stage looks like in practice, where it tends to break, and what leading teams do differently:
1. Learning activity: the foundation
The learning activity stage is the starting point of the chain: it describes whether learning is actually happening. Are learners enrolling in courses, completing training, attending sessions? This stage captures the foundational activity of your program, and completion rate is the primary metric that tells you whether the chain can move forward at all.
- Why it matters: When learning activity is happening at scale, learners enrolling, engaging, and completing, it signals that the chain has a foundation to build on. Completion is the primary metric here because it determines whether any behavior change, and therefore any business outcome, is possible. An organization can invest in great content and a strong platform, but if learners aren’t finishing what they start, the rest of the chain has nothing to work with.
- Risk of immaturity: Low or unmeasured completion leaves organizations unable to tell whether learning is actually happening at the scale the program was designed for. High enrollment numbers can look healthy on a dashboard while the majority of learners are disengaging before they finish. Without completion data, there’s no way to know whether the chain is running or stalled at the very first link.
- What leaders do differently: They treat completion as a primary program metric, not an afterthought. They monitor where learners drop off, identify the content or format issues that cause disengagement, and design learning experiences that make it easy to finish. Learning activity that doesn’t complete doesn’t compound.
2. Behavior change: the growth signal
The behavior change stage measures whether learners are actually doing things differently after completing training: adopting features, moving through onboarding faster, resolving issues or doing business independently, and extracting more value from the product. Completion is the mechanism. Changed behavior is the outcome.
- Why it matters: 58 percent of organizations say course completion leads to faster product adoption, 55 percent report faster onboarding, and 49 percent see higher renewal and expansion likelihood when learners complete training. On the flip side, 42 percent see reduced product adoption and 35 percent see lower renewal rates when learners disengage. Completion isn’t just a learning metric. It’s a leading indicator of business performance.
- Risk of immaturity: Low completion breaks the chain before behavior change can happen, which means none of the downstream business impact ever lands.
- What leaders do differently: They design for momentum, not consumption. They monitor drop-off points, structure learning around the jobs learners need to do, and treat completion as a leading indicator of growth, not a vanity metric.
3. Business outcomes: where value is created
he business outcomes stage is where behavior change produces results the business can actually measure. Product adoption rates, support ticket volume, onboarding speed, customer confidence, renewal rates, and expansion activity all belong here. This is the stage where learning stops being an internal program metric and starts showing up in the numbers leadership uses to make decisions.
- Why it matters: This is where learning starts touching the metrics that show up in board decks. Product adoption, feature usage, faster onboarding, reduced support burden, stronger customer confidence, and revenue are all outcomes that flow from the behavior changes learning drives. This is also the stage where learning data and business data need to be in conversation with each other, not sitting in separate systems.
- Risk of immaturity: Without behavioral insight, organizations can’t link learning to business results. They end up with strong learning data and strong business data that never talk to each other, with no way to show the connection between them.
- What leaders do differently: They track revenue, retention, adoption, and usage metrics alongside learning data. They align training outcomes with customer success and revenue goals, and design learning paths around the real-world actions that drive those outcomes.
4. Revenue impact: the compounding outcome
The revenue impact stage is where the full chain becomes visible as a business asset. It captures the three paths through which learning generates financial returns: retention (reduced churn and increased lifetime value), expansion (upsell, cross-sell, and account growth), and monetization (direct course and certification revenue). What makes this stage distinctive is that when all three paths are active, the returns compound.
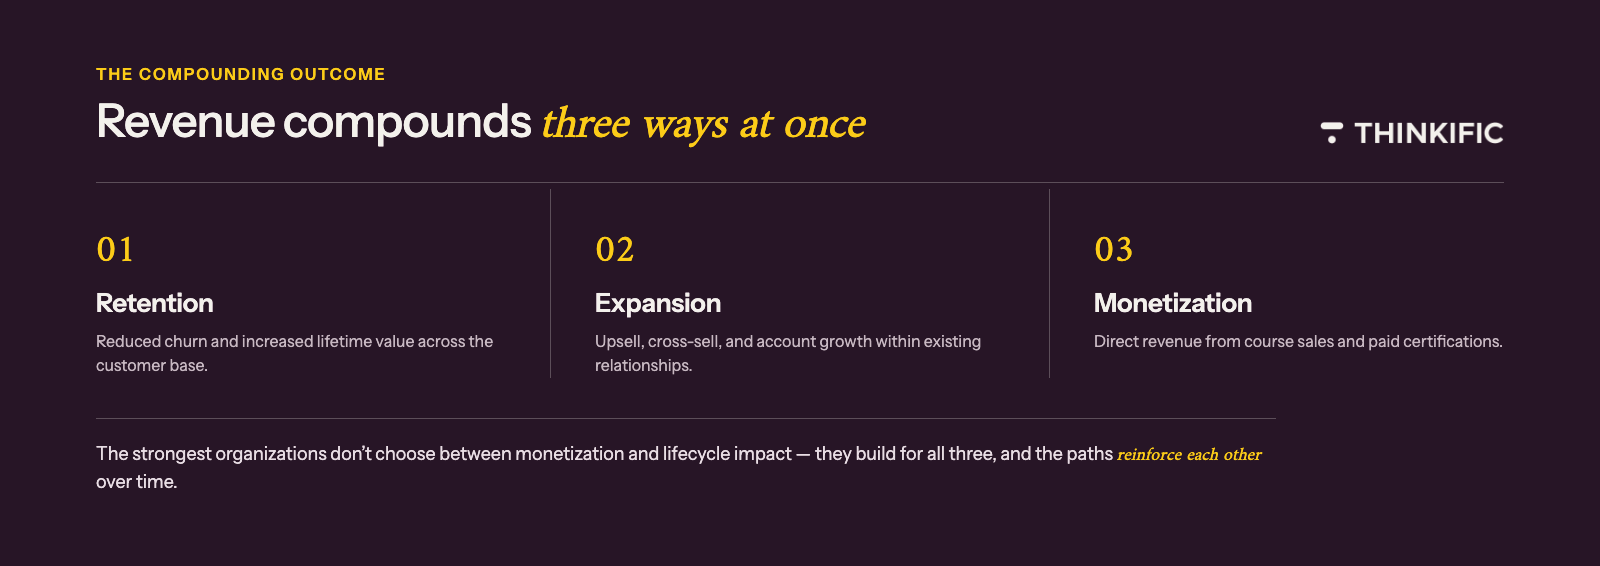
- Why it matters: When learning, completion, behavior change, and measurement are aligned, revenue impact doesn’t just add up. Direct course revenue builds brand authority that supports retention. Retention creates the customer relationships that expansion revenue depends on. Organizations that design for all three paths simultaneously see returns that reinforce each other over time.
- Risk of immaturity: Organizations that optimize for only one revenue path miss compounding impact. The strongest programs design for both monetization and lifecycle impact. When those paths run in isolation, the majority of education’s revenue potential goes unrealized.
- What leaders do differently: They treat learning as growth infrastructure: a connected system that supports the entire customer lifecycle rather than a series of programs running in isolation. For a deeper look at how this plays out in practice, see how customer success teams use education to drive retention and expansion.
Measurement: the strategic unlock
The four stages of the chain are what you build. Measurement is how you make it visible.
You can have great learning activity, strong completion, real behavior change, and meaningful revenue impact, but if you can’t see the connections between them, none of it shows up in the language the business uses to make decisions. The chain is doing the work. Measurement is what proves it.
This is the link that separates learning leaders from laggards. It’s also where most teams get stuck.
Thinkific’s research outlines a measurement maturity curve in four stages:
- Stage 1 – Activity tracking: Teams measure enrollments, completions, and engagement. Useful, but not enough to demonstrate business impact.
- Stage 2 – performance insight: Teams analyze learner behavior, drop-off points, and engagement patterns to optimize learning design. This improves the program but doesn’t yet prove it.
- Stage 3 – Business impact measurement: Teams integrate learning data with CRM, support, product, and revenue systems. This is where ROI, executive buy-in, and strategic influence all become possible.
- Stage 4 – Revenue impact: Teams directly attribute retention rates, expansion revenue, and customer lifetime value to specific learning programs. This is where learning earns a seat in growth strategy discussions, not just the learning team’s reporting.
Most organizations sit somewhere in Stages 1 or 2. The 41 percent who can’t connect learning data to their business systems are functionally locked out of Stages 3 and 4, no matter how good their content is.
What leaders do differently: they integrate LMS data with revenue systems, track behavior change alongside learning metrics, and use analytics to guide strategic decisions, not just report on them. Measurement isn’t something they bolt on at the end. It’s built into the chain from the start.
Where most teams actually are
Here’s the uncomfortable truth: the hard part isn’t agreeing the chain matters. Almost every leader nods along to the framework.
The hard part is figuring out where your specific chain is breaking.
Is your content disconnected from outcomes? Are learners enrolling but not completing? Is behavior changing but your data can’t see it? Or is everything working, and your measurement infrastructure just can’t connect the dots back to revenue?
Most teams have one weak link. The ones who outperform aren’t the ones with the prettiest content or the biggest learning team. They’re the ones who diagnose the break, fix it, and move to the next stage.
Find your stage in 5 minutes
The short Learning Impact Assessment gives you everything you need to move to the next stage:
- A diagnostic of which link is breaking in your specific program
- Personalized recommendations based on your stage
- A toolkit of hand-picked templates to put it into action: executive slide templates, KPI mapping templates, an executive reporting dashboard framework, and an internal pitch deck template
No signup. No sales pitch. Just a diagnostic built directly on the research in this article.