
TL;DR
If you are comparing Thinkific Analytics vs Teachable Analytics, you are really asking one question:
“Do we need analytics that help us run a business around education, or analytics that give us basic visibility for a solo course operation?”
- Thinkific gives you a unified view of revenue, enrollments, engagement, funnels, and community, with optional Advanced Analytics for custom dashboards, role-based access, and automated reporting.
- Teachable offers solid course and sales reports that work well for businesses who want to see completions, student progress, and earnings, but it is less suited to teams that need deeper learning insights, funnel visibility, or stakeholder-ready reporting at scale.
Skip ahead:
- Outcome 1: Prove ROI and business impact
- Outcome 2: Understand learner engagement and success
- Outcome 3: Understand what drives growth and conversions
- Outcome 4: Create custom dashboards for personalized situations
- Outcome 5: Enable the right people to access the right insights
Outcome 1: Prove ROI and business impact
When you bring an LMS into your organization, leaders will eventually ask the same question:
“What are we getting back from this investment?”
That might look like direct training revenue, improved adoption, lower churn, better partner performance, or compliance outcomes. To answer that, you need analytics that go beyond usage.
Thinkific strengths and limitations
Thinkific Analytics is built to help you tell a complete ROI story, not just show activity.
With Thinkific, you can:
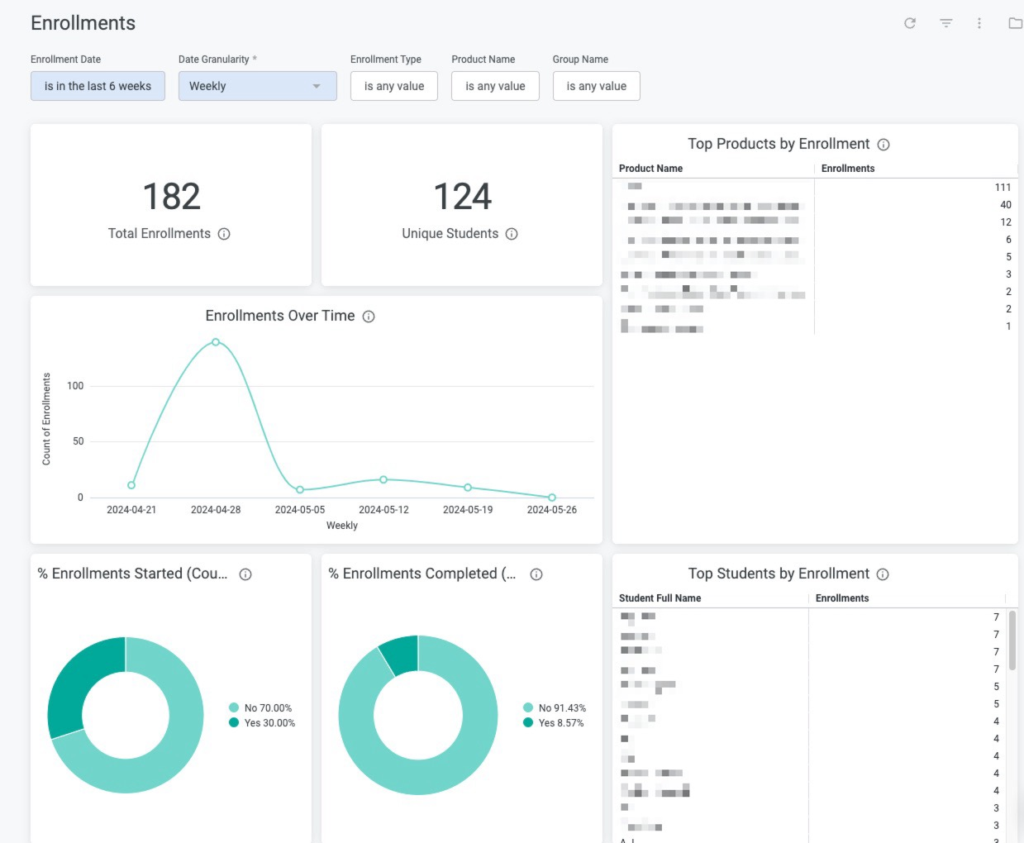
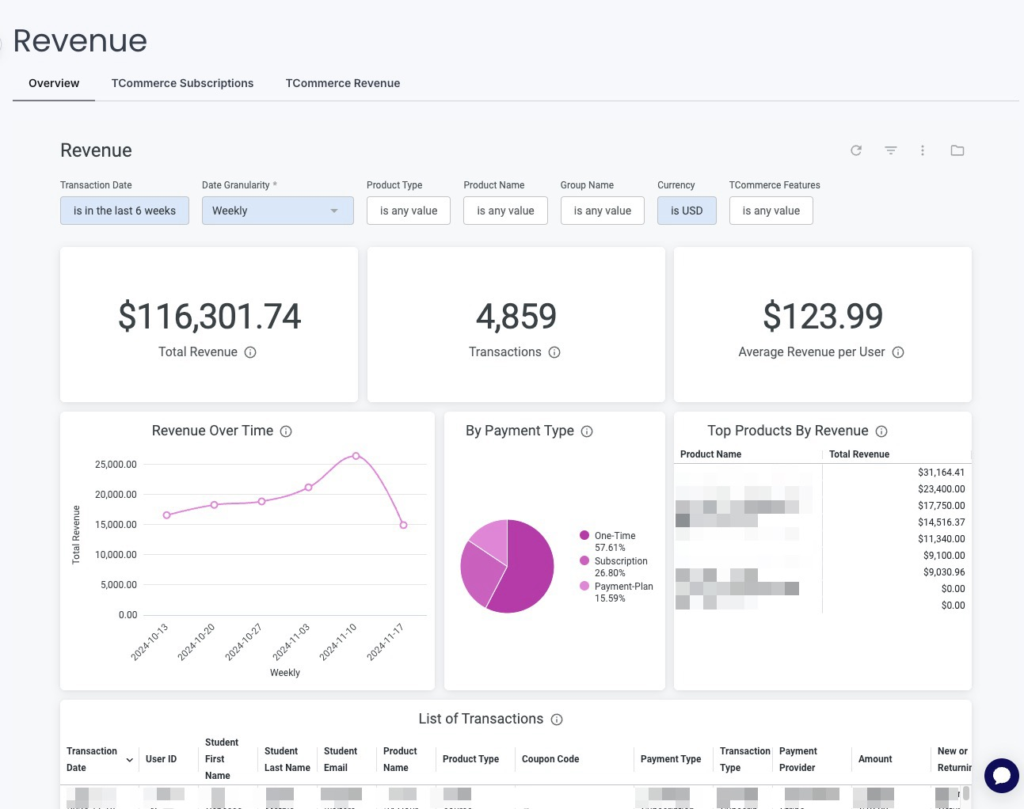
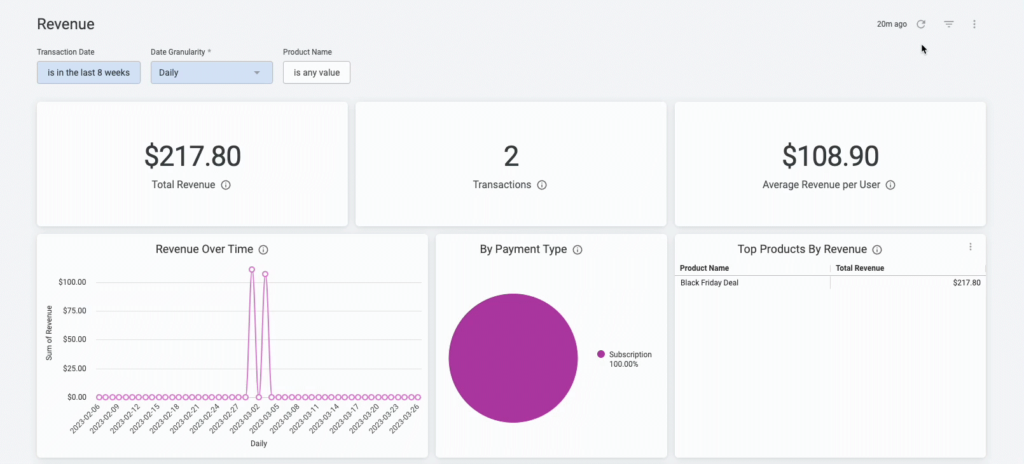
- See revenue dashboards that highlight top products, trends, ARPU, and subscription health
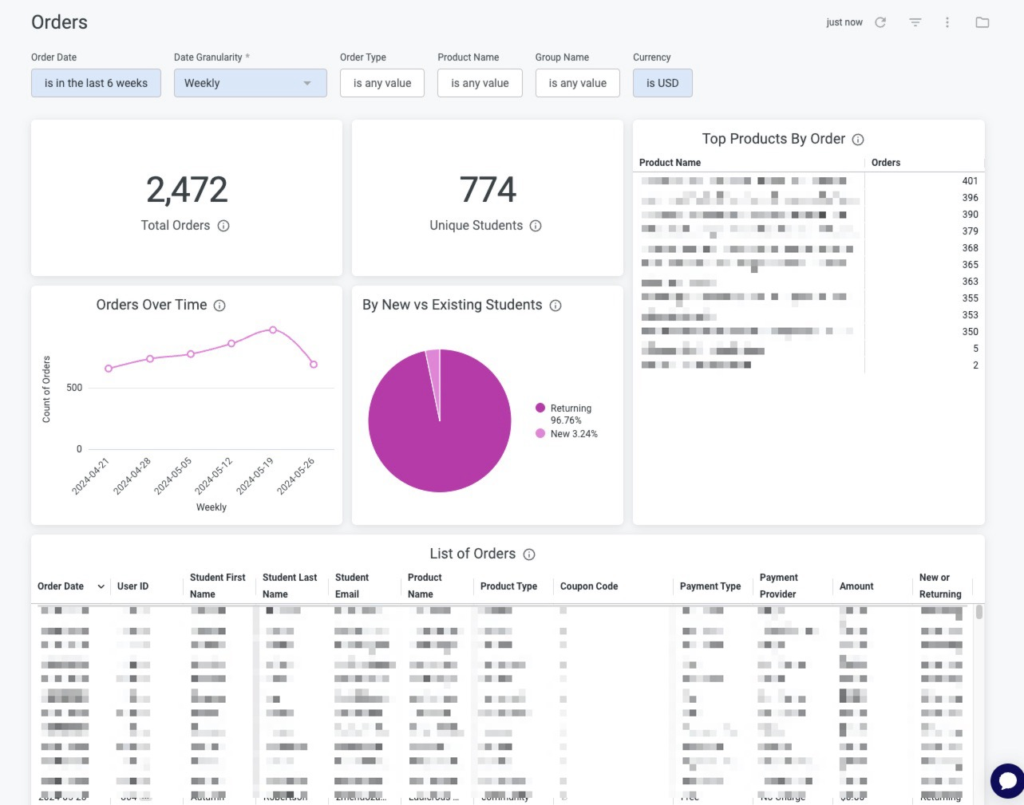
- Use enrollment and order reporting to track growth across courses, bundles, memberships, and communities
- Connect engagement and completion data to outcomes, so you can show how learning contributes to revenue, retention, or expansion
- Share executive-friendly reports that help you communicate program performance to leadership or external stakeholders
For more complex scenarios, Advanced Analytics supports custom KPIs, dashboards, and scheduled reporting, so you can align analytics directly to your internal targets and reporting cadence.
Thinkific focuses on being a clear, usable analytics layer inside the LMS. So, if your team requires more advanced financial modeling, they can export Thinkific data and integrate it with other systems or business intelligence tools for further analysis.
Teachable strengths and limitations
Teachable gives creators straightforward visibility into earnings and course performance.
With Teachable, you can:
- Use sales reports and a Sales Analytics dashboard to track total sales, earnings, refunds, fees, and payouts
- See where sales came from and how your school is performing at a high level
- Review course reporting and student progress to understand completions and quiz performance
This works well if your main ROI question is: “How much did we earn and which courses contributed most?”
However:
- Learner analytics and business analytics are not tightly connected into a single ROI narrative
- You cannot easily blend revenue, enrollment, and engagement into a single custom view, which makes it difficult for B2B customers to prove ROI to leadership.
| Takeaway If you need to prove ROI and business impact to stakeholders or clients, Thinkific makes that easier by combining revenue, enrollment, and engagement insights in one place.Teachable provides basic earnings and progress data, which is enough for many solo creators or small business owners, but it does not provide the same foundation for building a full business-impact story around education. |
Outcome 2: Understand learner engagement and success
Revenue tells you what sold. Engagement and success tell you what worked.
To improve learning outcomes, you and your team need to see:
- Where learners stay engaged
- Where they slow down or drop off
- How assessments and activities support real understanding
Thinkific strengths and limitations
Thinkific gives you a rounded view of learner engagement across lessons, video, assessments, and community.
You can:
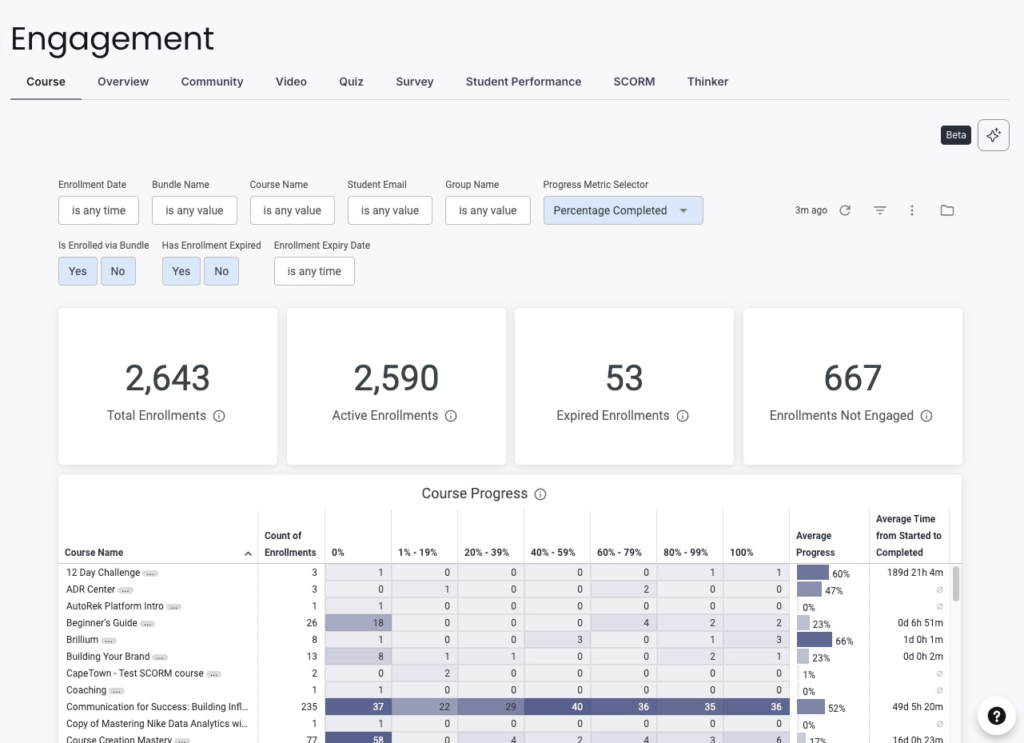
- See lesson-level completion, time spent, and last activity, which helps you spot friction points, identify lessons learners revisit, and understand where people tend to drop off
- Review quiz, survey, and assignment analytics to understand how well learners grasp key concepts and which parts of your content may need clarification or improvement
- Use video engagement metrics such as plays, watch time, and drop-off points to refine important sections of your lessons and improve how complex ideas are explained
- View per-learner reporting across courses, bundles, and other products, so you can identify high performers, inactive learners, or those who may need additional support
- Track community engagement, including cohort participation, discussion activity, and how learners interact with peers throughout the program
This balance across different engagement signals helps your team improve content, adjust learning paths, and support learners more intentionally, without needing specialist analytics skills.
Thinkific aims for depth plus usability, not extreme granularity in a single content type. It gives you enough detail to act, but not dozens of separate video graphs to analyze manually.
Teachable strengths and limitations
Teachable offers strong basic visibility into course and student activity, especially for individual creators.
You can:
- Track lesson completion so you know which students finished each section, and where they dropped off.
- See video viewing behavior, including how much of a video was watched
- Review quiz scores and basic course leaderboards
- Use student progress reports to understand who is moving forward and who is stuck
However:
- Engagement data is less integrated across the whole ecosystem – for example, you do not get the same blend of lessons, assessments, communities, and revenue in one view
- Per learner reporting is more limited in terms of advanced filtering, segmentation, or cross-product behavior
- It is harder to use learner analytics as a foundation for structured B2B reporting or internal stakeholder updates
| Takeaway Teachable’s engagement analytics work well if you need simple, course-level visibility into completions and viewing behavior for your own school.Thinkific is better suited if you want a more complete engagement picture that spans lessons, video, assessments, and community, and if you need to use that engagement data to improve programs or report on learner success to others. |
Outcome 3: Understand what drives growth and conversions
To grow your programs, you need to understand how learners move from interest to enrollment, not just what happens after they buy.
Key questions include:
- Which landing pages and offers convert best?
- Which channels consistently bring in engaged learners?
- Where do people drop off before checkout?
Thinkific strengths and limitations
Thinkific Analytics gives you funnel and conversion visibility inside the LMS so you can act without juggling multiple tools.
You can:
- Use funnel reporting to see how visitors move from page views to checkout. This helps you understand where prospects convert and where they drop off in the buying journey
- Track lead magnet performance and landing page activity to identify which assets attract qualified learners and which pages drive the most sign-ups or conversions
- Monitor checkout success and failure, so you can quickly spot friction at the point of purchase and improve the checkout experience
- View revenue breakdown by product, campaign, and source, so you can see which programs, offers, or marketing channels contribute most to growth
This helps you connect marketing efforts to enrollments and revenue without needing a separate analytics stack for basic funnel questions.
However, Thinkific is not a full marketing attribution platform. For very advanced campaign-level analysis, many teams still pair Thinkific with tools like Google Analytics or an external attribution tool.
Teachable strengths and limitations
Teachable provides strong visibility into earnings and transaction history, along with integrations that let you dig deeper into marketing performance using external tools.
You can:
- Use sales analytics, transaction reports, and earnings statements to understand revenue and payouts
- Integrate Google Analytics 4, Tag Manager, and Hotjar to track traffic, behavior, and website funnels
This setup can work if your team is comfortable pulling funnel and conversion insights from external marketing tools, then connecting that understanding back to Teachable manually.
However:
- Teachable does not provide a fully unified, in-platform funnel view that connects visitors, landing pages, and checkout with learning outcomes
- You do not get funnel analytics that sit alongside course performance and engagement in a single dashboard
- Understanding what drives conversions often means switching between tools and assembling the picture yourself
| Takeaway If you want to know which programs, campaigns, and pages drive growth without stitching together multiple systems, Thinkific gives you a clearer funnel picture inside the LMS.Teachable focuses more on the end result (sales and payouts) and leans on external tools for marketing and funnel analysis, which can work but requires more manual interpretation. |
Outcome 4: Create custom dashboards for personalized situations
Once your education programs involve multiple teams or client relationships, one default dashboard is not enough.
Executives, instructors, operations, and B2B clients all care about different questions. The more tailored you can make their view of analytics, the easier it is to get alignment and make decisions quickly.
Thinkific strengths and limitations
Thinkific’s Advanced Analytics is designed for organizations that need custom, role-aware dashboards.
With Advanced Analytics, you can:
- Build fully custom dashboards rather than relying only on fixed layouts
- Combine revenue, engagement, and marketing data into unified views
- Filter by cohort, timeframe, product, or audience type to answer specific questions quickly
- Create different dashboards for executives, instructors, account managers, or B2B clients
- Define custom KPIs and comparisons that match your internal targets, contracts, or program goals
This is especially valuable for B2B training, customer education, and multi-program academies where each stakeholder group needs a different lens on performance.
Because dashboards can be tailored by role, teams can structure analytics around how the organization actually operates. Executives can monitor revenue and program growth, instructors can track learner engagement, and account managers can review cohort or client performance.
This makes it easier for each team to focus on the metrics that matter most to their responsibilities.
Teachable strengths and limitations
Teachable’s analytics experience focuses on simple, out-of-the-box dashboards that require little setup.
You get:
- Course, student, and sales reporting views that are easy for a solopreneur or individual contributor to understand
- CSV exports that allow you to build your own reports in tools like spreadsheets or external dashboards
This suits solo creators or small teams who want a fixed, straightforward reporting experience without heavy configuration.
However:
- Teachable does not offer full custom dashboard building inside the product
- You cannot blend learning, revenue, and marketing data into a unified, role-specific view for different stakeholders
- Filtering and layout options are more limited compared to a dedicated custom dashboard layer like Thinkific’s Advanced Analytics
| Takeaway If your organization needs different dashboard views for different roles and consistent reporting across clients or internal stakeholders, Thinkific is better equipped for that level of customization.Teachable works well if you are comfortable with simple, fixed dashboards and are not trying to support many audiences with tailored analytics views. |
Outcome 5: Enable the right people to access the right insights
As your programs grow, analytics becomes a team sport. Different teams rely on different levels of visibility to do their work well.
- Leaders often need high-level summaries of revenue, growth, and overall program performance.
- Instructors typically need learner-level insights such as engagement patterns, lesson progress, and completion rates.
- Customer success teams or account managers may need account-level views to understand how specific organizations or cohorts are performing.
- B2B clients may also want visibility into how their own learners are progressing through assigned training.
Your LMS should make it easy to give each stakeholder access to the insights they need without manually copying data between reports.
It should also allow those insights to be shared without exposing sensitive information, so each group sees relevant performance data while the rest of the organization’s analytics remain protected.
Thinkific strengths and limitations
Thinkific is designed to support larger teams and B2B programs that rely on analytics.
You can:
- Set up multiple roles, including site admins, course admins, and group analysts, so different people can collaborate without exposing unnecessary data
- Use role-based access to make sure each internal team or B2B client only sees the dashboards and reports that are relevant to them. This includes row-level access so multiple users can view the same report but only the data relevant to their permission level.
- Automate report delivery through email, webhook, S3, or SFTP, so stakeholders stay updated without manual exports
This makes Thinkific a better fit if analytics is something you want to share widely and safely across teams or client organizations.
Teachable strengths and limitations
Teachable’s analytics model is primarily oriented toward the primary school owner.
You can:
- Use dashboards and reports to run your own business
- Export data for further analysis or sharing in spreadsheets or external tools
This works well if one person or a very small team owns all reporting.
However:
- There are no analytics-specific roles or granular permissions that let you safely expose tailored dashboards to instructors, internal teams, or B2B clients
- There is no built-in scheduled or automated analytics report delivery, which means keeping others informed often relies on manual exports or screenshots
| Takeaway If you have multiple stakeholders who rely on analytics, internally or externally, Thinkific is built with that complexity in mind.Teachable is better suited for solo creators and small teams who run their own reports and do not need to distribute or control access to analytics at scale. |
Final recommendation
Choosing between Thinkific Analytics vs Teachable Analytics comes down to what you expect analytics to do for your business.
If you need analytics to act as an intelligence layer for your education strategy, Thinkific is the stronger fit. If you mainly need straightforward visibility into course performance and earnings for a single creator business, Teachable can be enough.
Choose Thinkific if
- You want visibility across revenue, engagement, funnels, and community in one place
- You need to prove ROI and business impact, not just track sales
- You work with internal teams or B2B clients and need to share tailored insights
- You want custom dashboards, granular permissions, and automated reporting as programs grow more complex
Choose Teachable if
- You want simple reporting focused on sales, completions, and basic progress
- Your business model is straightforward course delivery run by a solo creator or small team
- You do not need deep learning analytics, funnel insights, or role-based dashboards
Final takeaway
Thinkific is best suited for organizations that treat analytics as a full business intelligence layer for education, connecting learning, revenue, and growth.
Teachable is a better fit for sales-focused creators who care most about understanding course performance and straightforward revenue reporting without complex analytics requirements.
See your learning data more clearly with Thinkific
If you are ready to move beyond basic reporting and start using analytics to run and grow your education programs, Thinkific can help.
You can:
- Start a free 30-day Thinkific trial to explore Analytics capabilities firsthand
- Book a call with our team if you are evaluating an LMS for a larger training organization, customer education program, or B2B academy and want help designing the right reporting setup