
TL;DR
When comparing Thinkific and LearnWorlds, the key question is what kind of insight your team needs to run and scale your programs.
- Thinkific focuses on giving teams a clear, connected and holistic view of their learning business. It brings together revenue, enrollments, engagement, and funnel reporting in one place, with Advanced Analytics you can build custom dashboards, enable role-based access, and automate reporting across teams or clients.
- LearnWorlds focuses more on learner and content-level analytics, particularly around video and lesson interactions. It also offers detailed filtering and segmentation for analyzing how learners engage with specific content.
Both platforms offer analytics, but they support different goals: LearnWorlds focuses on content-level analysis, while Thinkific is designed to help teams understand how learning performance relates to revenue, growth, and business outcomes.
Introduction
If you’re evaluating learning management systems for your education programs, analytics is likely a major part of the decision. Whether education is central to your business or supports a specific business goal like customer adoption, partner enablement, or retention, you need confidence that your LMS can show what’s working and where to improve.
As education becomes more embedded in how your organization operates, your LMS analytics needs to do more than report activity. You and your team need insights that help prove ROI, improve learning outcomes, and make informed decisions about where to invest next. Both Thinkific and LearnWorlds offer analytics as part of their LMS platforms, but they take different approaches. One prioritizes clarity across business performance and learning outcomes. The other goes deeper into learner behavior and content interaction.
This article is designed to help you evaluate how each LMS supports analytics in practice. Rather than focusing on features alone, it looks at how analytics connects to real business outcomes, from revenue and growth to learner success and reporting at scale.
Skip ahead:
- Outcome 1: Proving ROI and business impact
- Outcome 2: Understanding learner engagement and success
- Outcome 3: Understanding what drives growth and conversions
- Outcome 4: Creating custom dashboards for personalized situations
- Outcome 5: Enabling the right people to access the right insights
Outcome 1: Prove ROI and business impact
When you invest in an LMS, analytics needs to help you answer a core question: Is your education program delivering value to the business?
That value can come from:
- Direct revenue
- Improved retention
- Stronger product adoption, or
- Better performance across customers, partners, or internal teams
To prove ROI, you need more than usage data. You need a way to connect learning activity to meaningful outcomes.
Thinkific strengths and limitations
Thinkific Analytics is designed to help you connect learning performance to business results, so you can explain impact to leaders, clients, or other stakeholders.
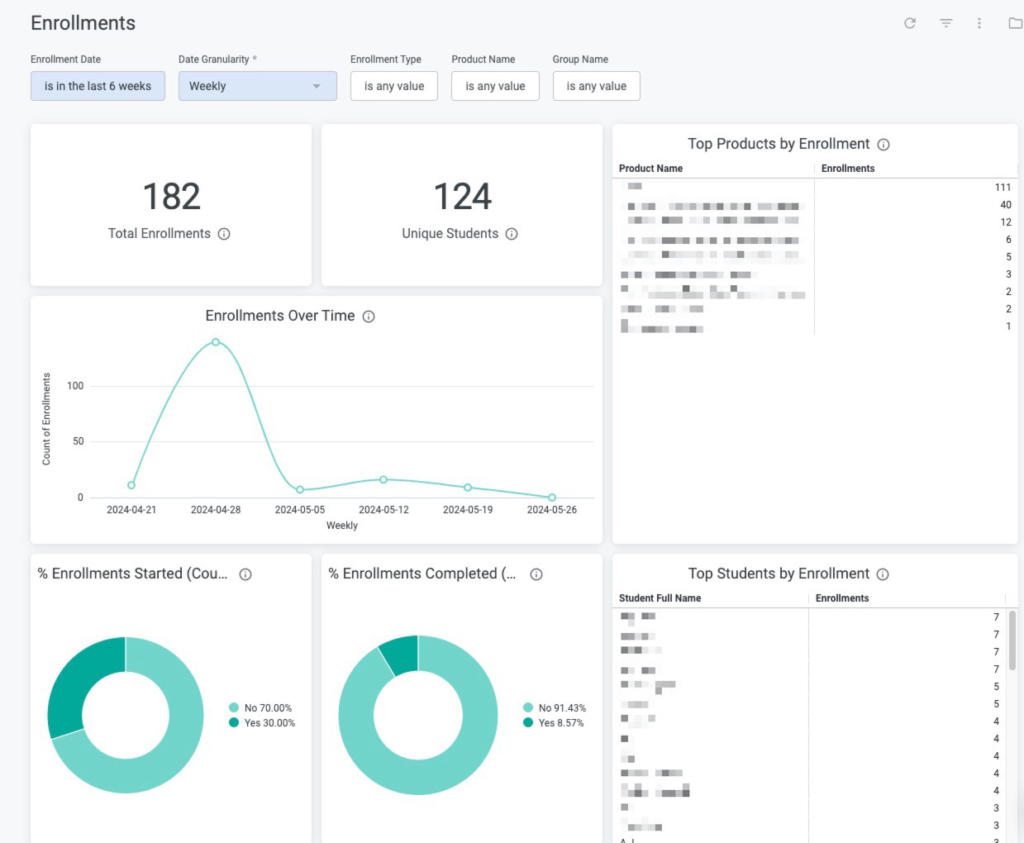
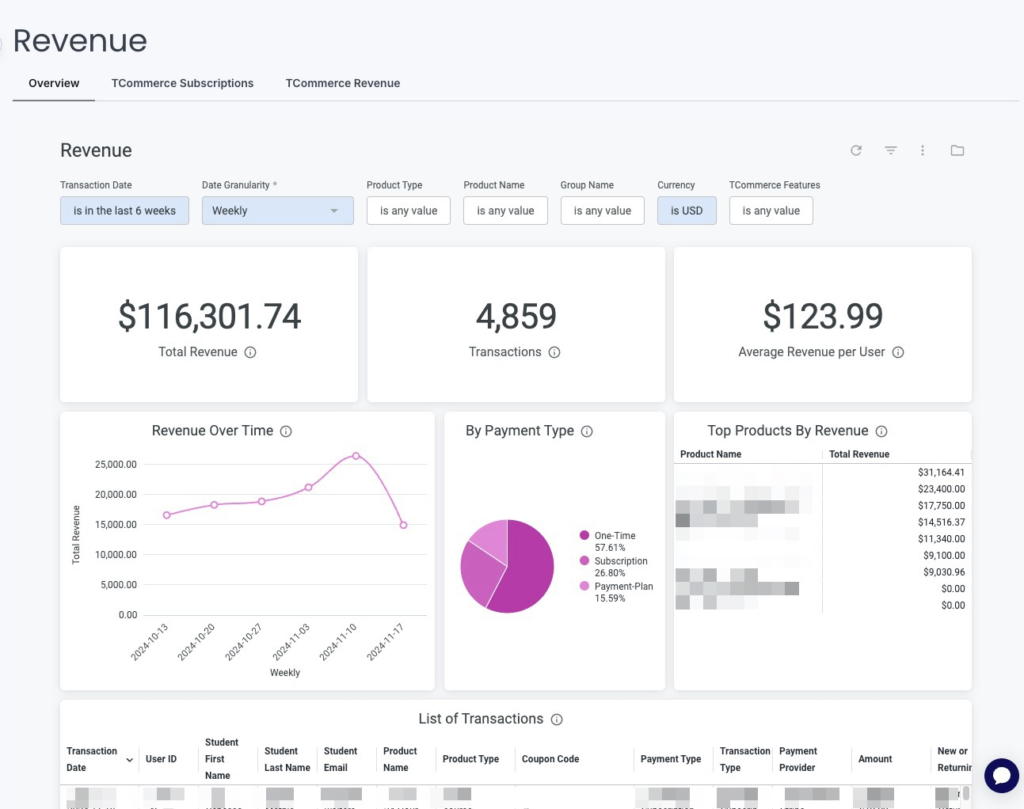
With Thinkific, you can:
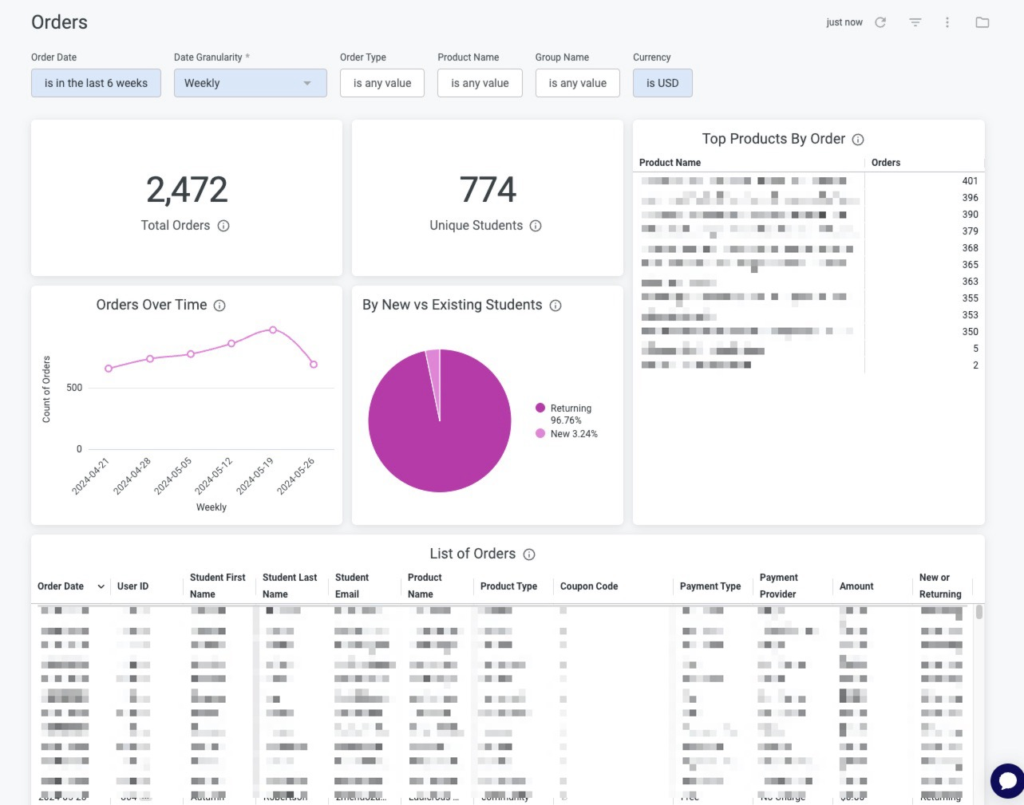
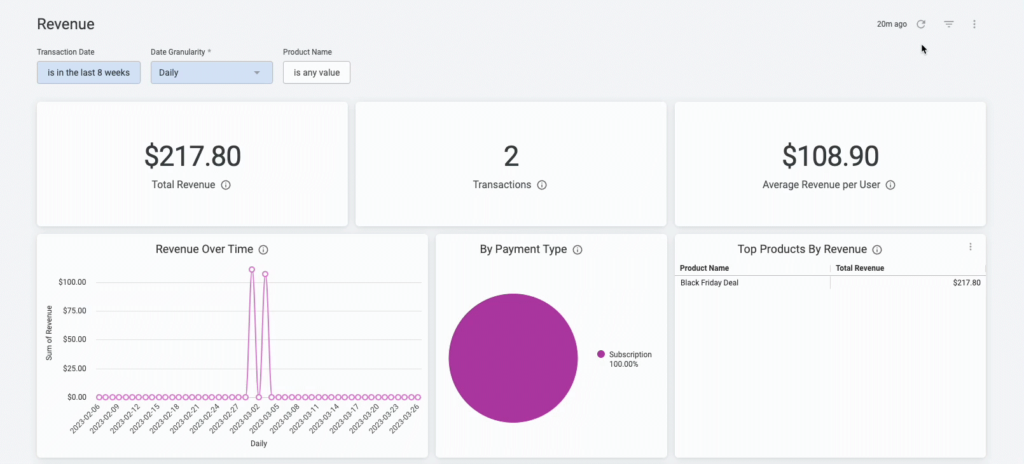
- View revenue dashboards that highlight top products, trends, ARPU (average revenue per user), and subscription health
- Use enrollment and order reporting to track growth across courses, bundles, memberships, and communities
- Connect engagement and completion data to outcomes, making it easier to show how learning contributes to revenue, retention, or expansion
- Share clear, executive-friendly reports when you need to communicate program impact beyond your immediate team
This makes Thinkific a strong fit if you need to justify investment in education, report on program performance as part of a broader growth strategy, or demonstrate value to B2B customers. Thinkific is designed to provide a clear, easy-to-use analytics layer within the LMS. If your team needs more advanced financial modeling, you can export Thinkific data and combine it with other systems or BI tools for deeper analysis.
LearnWorlds strengths and limitations
LearnWorlds Analytics leans more toward understanding learner and course behavior, with business views available but less central.
With LearnWorlds, you can:
- Access detailed reports on learner progress, course performance, and engagement, including dashboards for courses and training programs
- Use sales and revenue reports to see course revenue and subscriber trends.
This can work well if your primary goal is to analyze how learners move through content and you are comfortable combining learning reports with other systems for a full ROI picture.
However, LearnWorlds’ native analytics are more heavily weighted toward course and learner behavior than toward a unified view of business impact across revenue, funnels, and learning outcomes.
If you need to tell a clear ROI story to leadership or B2B clients, you may still need to bring LearnWorlds data into external tools or additional financial analysis to complete that narrative.
| Takeaway Most training companies and B2B education programs need to do both: improve learning and prove its impact.Thinkific supports this more directly by combining revenue, enrollment, and engagement data into views that help you communicate ROI. LearnWorlds gives you strong insights into learner behavior and course performance, but provides less built-in support for telling a full business impact story end-to-end. |
Outcome 2: Understand learner engagement and success
If you want your educational programs to improve over time, you need to look beyond who enrolled and who finished. You need to understand how learners move through content, where they get stuck, and which activities actually drive progress.
Engagement and success metrics help you and your team answer questions like:
- Are learners staying engaged throughout the program?
- Which lessons or activities are most effective?
- Where are people dropping off or losing momentum?
Thinkific strengths and limitations
Thinkific Analytics is designed to give you a broad, balanced view of learner engagement across different content types and touchpoints.
With Thinkific, you can:
- Track lesson completion and time spent, to see where learners move smoothly and where they slow down
- Review quiz performance, survey responses, and assignments, to understand comprehension and sentiment
- Analyze video engagement and drop-off, so you can refine key content and keep attention high
- View per-student insights across products, helping you identify learners who excel or may need extra support
- Monitor community engagement, including participation in discussions and cohort activity
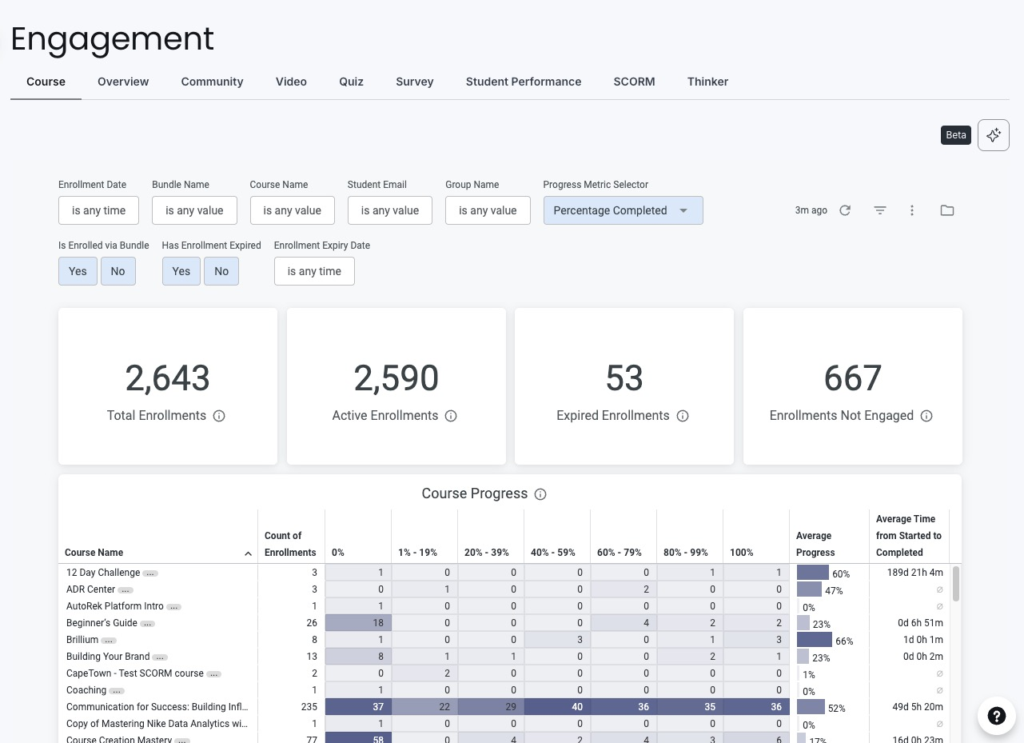
This gives you a rounded picture of how learners are engaging with your programs overall, not just with one specific content format.
The trade-off is that while Thinkific offers strong depth across these areas, it doesn’t go as far into hyper-granular video analytics as some specialized tools do.
It focuses instead on giving you a more holistic view across courses, communities, assessments, and other learning experiences, so teams can make data-driven decisions across their entire education business, not just video content.
LearnWorlds strengths and limitations
LearnWorlds stands out for its depth in video and lesson-level interaction analytics.
With LearnWorlds, you can:
- Access to detailed video analytics, including user engagement at a fine-grained level
- Examine lesson interaction and behavior data, drilling into how learners navigate and engage with specific elements
- Use more than 70 filtering options to segment and analyze learner behavior in different ways
This can be a strong fit if your top priority is understanding exactly how learners interact with individual lessons or videos.
However, this depth is more heavily concentrated in video and lesson analytics. Engagement views outside those areas are less emphasized, and the overall experience can feel more complex to navigate if your team wants a broader engagement picture rather than an in-depth analysis.
| Takeaway If you want a complete view of learner engagement across lessons, assessments, video, and community activity, Thinkific provides a more balanced approach. Teams can filter down into individual courses, lessons, or learners, while also comparing performance side by side to understand trends and relative impact.LearnWorlds places more emphasis on drilling into a single course or learner, which can be useful for detailed interaction analysis but offers less visibility into how performance compares across your broader learning programs. |
Outcome 3: Understand what drives growth and conversions
To grow your education programs, you need to understand how people move from interest to enrollment. It’s not enough to know how many learners signed up. You and your team need visibility into which programs, channels, and pages contribute to revenue, and where potential learners drop off.
Funnel and conversion analytics help you answer questions like:
- Which landing pages and offers convert best?
- Where in the journey do people hesitate or abandon checkout?
- Which channels bring in learners who actually engage and succeed?
Thinkific strengths and limitations
Thinkific Analytics is designed to give you in-platform visibility into what drives growth, from first touch to enrollment and early engagement.
With Thinkific, you can:
- Use funnel reporting to see how visitors move from page views to checkout
- Track lead magnet performance and landing page activity, so you know which assets attract qualified learners
- Monitor checkout success and failure, helping you pinpoint friction at the final step
- View revenue breakdown by product, campaign, and source, making it easier to see which offers and channels contribute most to growth
- Use AI-powered analytics summaries to quickly understand key trends, surface insights, and make decisions without manually digging through reports
This gives you a connected picture of how learners discover, evaluate, and ultimately enroll in your programs, without having to stitch everything together manually.
Thinkific focuses on the parts of the funnel most relevant to learning and revenue decisions. So, if your team needs very advanced campaign attribution or complex multi-touch marketing views, you may have to pair Thinkific with dedicated marketing analytics tools.
LearnWorlds strengths and limitations
LearnWorlds provides business and performance dashboards that help you see how your academy is doing, including sales and revenue reports and AI-powered insights that can answer questions across learners, courses, revenue, and engagement.
With LearnWorlds, you can:
- Use business and sales dashboards to monitor performance across key metrics
- Access and explore data about revenue, learner performance, and engagement metrics across different reports
This can work well if you’re comfortable using a mix of LearnWorlds dashboards and external analytics tools to understand how your funnels perform.
However, it’s worth noting that LearnWorlds leans more heavily on external tools like Google Analytics, Facebook Pixel, and Tag Manager for deeper marketing and funnel analysis, rather than offering a strongly unified, in-platform view that directly connects campaigns, landing pages, and product performance with learning outcomes.
That means you may need more manual setup and interpretation across systems to understand exactly what drives purchases and long-term program growth.
| Takeaway Most organizations want to understand not just who enrolled, but how they got there and which paths lead to sustainable growth.Thinkific makes that picture clearer inside the LMS by connecting funnel behavior, conversion, and revenue at the product level. LearnWorlds offers business and sales reports plus AI insights, but relies more on a combination of external marketing tools and internal dashboards to assemble the full story of what drives purchases. |
Outcome 4: Create custom dashboards for personalized situations
As your education programs grow, a single default dashboard stops being enough. Different people on your team care about different questions:
- Executives want a high-level view of performance and ROI
- Instructors need learner-level insight, and
- Account managers or B2B clients often need program-specific reporting
Custom dashboards let you adapt analytics to those needs instead of forcing everyone to interpret the same view. The more complex your programs and audiences become, the more important this flexibility is.
Thinkific strengths and limitations
Thinkific supports deeper customization through Advanced Analytics, available on the Plus plan and designed for teams that need dashboards tailored to their structure and goals.
With Advanced Analytics, you can:
- Build fully custom dashboards, starting from flexible layouts rather than fixed templates
- Combine revenue, engagement, and marketing data in a single view so you can see how learning and growth connect
- Use filters for cohorts, timeframes, segments, and products to answer specific questions quickly
- Create different dashboards for executives, instructors, account managers, and B2B clients, each focused on the metrics that matter to them
- Define custom KPIs and comparisons, aligned to internal targets, contracts, or program goals
This makes Thinkific a strong fit if you need consistent but tailored reporting for multiple roles or external stakeholders, especially in B2B or multi-program environments.
LearnWorlds strengths and limitations
LearnWorlds offers powerful segmentation and filtering, with more options than Thinkific for drilling into specific learner groups and behaviors.
With LearnWorlds, you can:
- Apply more than 70 filters to segment and analyze data in highly specific ways
- Use strong segmentation capabilities to explore how different audiences interact with content
- Use roles and permissions to control who can view analytics while keeping sensitive data restricted
This can be valuable if your primary focus is slicing learner data in many different ways for analysis.
However, dashboard layout customization is more limited. You don’t get the same level of control to build fully custom dashboards that blend revenue, engagement, and marketing views or design role-specific layouts for different stakeholders.
That makes it harder to create custom reporting experiences for executives, instructors, or B2B clients.
| Takeaway If your team needs different dashboard views for different roles, or you run B2B programs where clients expect consistent reporting, Thinkific’s Advanced Analytics is better suited to that level of customization.LearnWorlds gives you more ways to filter and segment data within its existing dashboards, but less flexibility to design fully custom, role-specific views that serve as shared reporting for your organization or clients. |
Outcome 5: Enable the right people to access the right insights
As your programs grow, analytics usually stop being a one-person responsibility. Leaders, instructors, operations teams, and sometimes B2B clients all need visibility into performance.
The challenge isn’t just having data. It’s making sure the right people can see the right insights without exposing sensitive information or creating constant manual reporting work for your team.
Thinkific strengths and limitations
Thinkific is designed with teams and B2B programs in mind, so multiple people can work with analytics while you stay in control of who sees what.
With Thinkific, you can:
- Support multiple roles, including site admins, course admins, and group analysts, so different team members can access the analytics they need without exposing irrelevant or sensitive data
- Use role-based access to ensure instructors, internal teams, and external B2B clients only see the dashboards and reports that are meant for them. This includes row-level access so multiple users can view the same report but only the data relevant to their permission level.
- Set up automated report delivery via email, webhook, S3, or SFTP, so stakeholders stay updated without your team constantly pulling and sharing data manually
This makes Thinkific a strong fit if you have internal teams or clients who rely on regular performance updates, or if you want analytics to function as shared infrastructure across your organization.
LearnWorlds strengths and limitations
LearnWorlds supports reporting and distribution as well, particularly through scheduled reports and exports.
With LearnWorlds, you can:
- Schedule and automate reports so stakeholders receive updates by email at defined intervals
- Use visual dashboards and charts that can be shared to communicate training and course performance
This can work well if a central team owns analytics and uses scheduled reports to keep others informed.
The tradeoff is that, with LearnWorlds, there is less emphasis on granular, analytics-specific permissions or role-based dashboard views tailored separately for executives, instructors, account managers, and B2B clients. Larger teams may still lean on exports or manually curated reports when they want to control exactly which analytics different stakeholders see.
| Takeaway Training companies and B2B education programs often need controlled access and scalable reporting, especially when multiple teams or clients depend on analytics.Thinkific is better suited to that reality, with built-in roles, controlled access, and automated reporting designed for multi-stakeholder environments. LearnWorlds offers scheduled reports and shareable dashboards, but puts less focus on role-based analytics access, which can require more manual work as your reporting needs and audience grow. |
Final recommendation
Choosing between Thinkific and LearnWorlds comes down to what you need analytics to do for your team.
If your priority is understanding how learning, revenue, and growth all connect, you’ll want an LMS that gives you a clear, unified view. If your top concern is mostly deep analysis of lesson and video interactions, you may prioritize a different kind of depth.
Choose Thinkific if
You and your team want:
- Full visibility across revenue, engagement, funnels, and community in one place
- Analytics that help you prove ROI and business impact, not just track course usage
- Reporting that supports internal teams or B2B clients, with tailored insights for different stakeholders
- Custom dashboards, granular permissions, and automated reporting, especially as programs become more complex or multi-stakeholder
Thinkific is a strong fit if you treat analytics as part of your operating system for education, not just a reporting add-on.
Choose LearnWorlds if
You and your team:
- Care most about deep video and lesson interaction analytics
- Are comfortable working in a more complex analytics UX in exchange for more granular filtering and behavior analysis
- Do not need strong, in-platform revenue or funnel reporting, or are happy to rely on external tools for that view
LearnWorlds is a good fit if your primary focus is understanding content-level engagement in detail, rather than connecting learning data directly to business performance inside the LMS.
Takeaway
Thinkific provides broader visibility across learning, revenue, growth, and stakeholders, making it easier to treat analytics as a practical business intelligence layer for education.
LearnWorlds provides deeper insight in specific areas, especially video and lesson interactions, but with less emphasis on unified business impact and shared reporting across teams.
The right choice depends on what you need to see more clearly: the whole learning business, or what happens inside each lesson.
Ready to see your learning data more clearly?
If you want analytics that connect learning, revenue, and growth, Thinkific can help your team move beyond surface-level reporting.
You can explore Thinkific on your own to see how analytics work across courses, communities, and revenue. Or, if you are evaluating an LMS for a larger training organization or B2B program, our team can help you design the right reporting setup from day one.
- Start a free 30-day Thinkific trial to explore analytics and reporting firsthand
- Book a call with our team if you need support for multi-team, B2B, or enterprise learning programs