

A quarterly business review is coming up. Your learning program has healthy enrollment numbers, learners are completing courses, and engagement looks strong.
Then someone asks a simple question: How do we know the program is working?
For many learning teams, that’s where the hard part starts.
Learning data is often spread across learning platforms, assessment tools, reporting dashboards, and other systems. Pulling that information together into a clear picture of program performance can take hours. The pressure to demonstrate impact continues to grow. According to SHRM, organizations see an average return of $7 for every $1 invested in leadership development.
Learning teams are increasingly expected to show which programs contribute to those results and where future investment should be focused. Training analytics software helps teams connect learner activity, engagement, and outcomes so they can make better decisions and communicate results more clearly.
In this article, you’ll learn what training analytics software is, how it differs from basic LMS reporting, which metrics matter most, and what to look for when evaluating platforms.
Skip ahead:
- What is training analytics software?
- Why LMS reporting isn’t always enough
- Which training metrics matter most?
- Who benefits from training analytics software?
- How high-performing learning teams use analytics
- What to look for in a training analytics platform
- Top training analytics software platforms
- 6 Top training analytics software platforms
- How to choose the right training analytics software
What is training analytics software?
Training analytics software is a category of tools that collect, organize, and analyze learning data so organizations can measure learner performance, track outcomes, and improve training programs.
Most learning teams already collect learner, assessment, and program data. Course completions live in one system, assessment results in another, and learner records somewhere else. Pulling those pieces together often takes more effort than expected.
That’s where analytics software helps. It connects learning data across systems and gives teams a clearer view of learner progress, program performance, and outcomes.
At a practical level, training analytics helps teams understand what happened, why it happened, and where to focus next.
Many organizations move through three stages as their approach to learning measurement matures.
Stage 1: Tracking
Most teams start by measuring participation.
Common metrics include:
- Enrollments
- Attendance
- Course completions
These metrics help answer straightforward questions: Are learners showing up? Are they completing training? Which programs are getting the most participation?
For many organizations, this is where reporting begins.
Stage 2: Analysis
Once participation data is available, teams typically want more context.
They want to understand how learners move through a program, where engagement drops, and which content performs best.
Common metrics include:
- Learner engagement
- Assessment scores
- Progress through learning paths
- Drop-off points within a course or program
A training academy might discover that learners consistently disengage after a specific module. A customer education team may find that certain courses correlate with stronger product engagement.
These insights help teams prioritize improvements and focus resources where they’ll have the greatest impact.
Stage 3: Optimization
The final stage connects the learning activity to business goals.
At this point, teams are looking beyond participation and engagement. They want to understand whether their programs are creating measurable results.
Examples include:
- Program effectiveness
- Certification success rates
- Customer adoption
- Compliance outcomes
- Training ROI
This is often where leadership becomes most interested. They want to know whether learning programs are contributing to broader organizational goals and where to focus future investment.
Analytics supports those conversations with data that goes beyond completions and attendance.
The strongest learning programs don’t stop at tracking activity. They use learner data to improve programs, demonstrate value, and drive better outcomes over time.
Why LMS reporting isn’t always enough
Most learning platforms include reporting features, and for many organizations, that’s where measurement begins.
You can usually see who enrolled in a course, who completed it, and how learners performed on assessments. Those reports help teams track participation and monitor day-to-day activity.
As learning programs grow, reporting requirements often become more complex.
A training company may need client-ready reports across multiple cohorts. A customer education team might want to understand which learning experiences drive engagement or product adoption. A certification provider may need visibility into completion trends and assessment performance over time.
Questions become harder to answer when information is spread across multiple systems.
Teams often find themselves:
- Exporting data from multiple platforms
- Combining information in spreadsheets
- Building reports manually for stakeholders
- Recreating the same reports every month
- Searching for answers across disconnected data sources
That extra work adds up. Time spent pulling reports is time that could be spent improving programs, supporting learners, or identifying new growth opportunities.
Stakeholders also tend to ask questions that go beyond participation metrics.
The questions stakeholders actually care about
Most stakeholders want to understand how learning programs are performing and where improvements can be made.
Questions often include:
- Which programs drive the strongest engagement?
- Where are learners dropping off?
- Which certifications are being completed?
- Which programs are producing the best outcomes?
- Which learning experiences deserve additional investment?
Answering those questions usually requires more context than a standard report can provide.
Which training metrics matter most?
Training analytics software can surface hundreds of data points. Most learning teams don’t need all of them.
The goal is to focus on the metrics that help answer important questions about learner success, program performance, and business impact.
A helpful way to organize training metrics is to group them into three categories: activity, performance, and outcomes.
Activity metrics
Activity metrics help teams understand participation.
Common examples include:
- Enrollments
- Attendance
- Time spent learning
These are often the first metrics teams review after launching a new course, certification program, or customer education initiative. A drop in enrollments may signal a promotion problem. Strong participation can indicate growing interest in a topic.
Activity metrics provide useful context, but they rarely explain how learners are progressing through a program.
Performance metrics
Performance metrics focus on what learners do after they enroll.
Key metrics often include:
- Completion rates
- Assessment performance
- Learner progress
- Engagement
A completion rate can reveal whether learners stay engaged long enough to finish a course. Assessment scores may highlight concepts that need additional support. Progress tracking can uncover friction points within a learning path.
Learning businesses and academies often use these metrics to identify which programs perform well and which experiences may need refinement.
The questions performance metrics help answer include:
- Which programs keep learners engaged?
- Where are learners dropping off?
- Which content may need improvement?
Outcome metrics
Outcome metrics connect learning activity to results.
The specific metrics vary by program type, but teams are generally trying to understand the same thing: what changed after learning occurred.
Examples may include:
- Compliance completion
- Customer adoption
- Certification achievement
- Operational improvement
- Revenue influence
A customer education team may focus on adoption and engagement. A certification provider may track credential attainment. A training company may look at learner outcomes and client success metrics.
These measures help connect learning programs to broader organizational goals and demonstrate the value of continued investment.
Teams looking to connect learning activity to business outcomes can use a training ROI template to measure impact and communicate results more clearly.
Who benefits from training analytics software?
Training analytics software supports a wide range of learning programs, including employee training, customer education, certification programs, professional training academies, and membership-based learning businesses.
While success looks different across these models, most teams are trying to answer the same questions: Are learners making progress? Which programs perform best? Where should we focus our attention next?
| Learning model | Questions analytics helps answer |
| Employee training | Are employees completing required training? |
| Customer education | Which learning experiences drive engagement? |
| Partner training | Which partners are certification-ready? |
| Professional training academy | Which programs produce the strongest outcomes? |
| Membership or learning business | Which content keeps learners engaged over time? |
As learning programs grow, reporting requirements often grow alongside them. Analytics helps teams maintain visibility without spending more time building reports.
How high-performing learning teams use analytics
High-performing learning teams treat analytics as an ongoing part of program improvement.
They review performance regularly, look for patterns, and use those insights to make targeted changes.
Analytics often highlights patterns that may not be obvious from learner feedback or completion data alone.
Common examples include:
- Courses with high drop-off rates
- Content that receives little engagement
- Programs with consistently strong completion rates
- Learners who may need additional support
- Trends that impact learner success over time
Imagine a customer education team notices that most learners leave a course after the second module. The team can review the content, clarify expectations, and identify where learners disengage.
A training academy might discover that one certification program consistently produces stronger assessment results than others. Understanding why that program performs well can help inform future course design decisions.
What successful teams do next
The specific actions vary, but a few patterns show up consistently.
They may:
- Improve onboarding experiences for new learners
- Adjust learning paths to reduce friction
- Update content that isn’t performing well
- Add resources for learners who need additional support
- Apply successful approaches across other programs
Small changes often add up. A revised onboarding sequence, a clearer lesson structure, or additional support materials can improve completion rates and engagement without requiring a full program redesign.
Analytics helps teams focus their efforts where they can have the greatest impact. It becomes easier to prioritize resources, support program changes, and communicate progress to stakeholders.
Many teams use a training dashboard to monitor these trends and track progress over time. A centralized view of learner performance can make it easier to identify issues early and measure the impact of changes after they’re implemented.
The strongest learning programs evolve over time. Analytics helps teams understand what’s working, where learners need support, and which changes are worth making next.
What to look for in a training analytics platform
The right platform depends on the questions you’re trying to answer.
A customer education team may want to understand which learning experiences drive product adoption. A training academy may need reporting across cohorts and certification programs. An L&D team might be focused on compliance, engagement, or workforce development.
Start by identifying the outcomes that matter most to your organization. Then evaluate platforms based on how easily they help you measure and report on those outcomes.
Reporting depth
Strong reporting helps teams move beyond basic completion tracking and understand how programs are performing over time.
Useful capabilities include:
- Completion reporting
- Assessment reporting
- Cohort reporting
- Trend analysis
For example, viewing completion rates across multiple cohorts can reveal patterns that may not be visible in a single course report.
Dashboard flexibility
Different audiences often need different levels of detail.
Leadership teams may want a high-level view of outcomes and trends. Program owners often need a closer look at learner progress, engagement, and performance.
Consider whether the platform offers:
- Executive dashboards
- Team-level reporting
- Custom reporting views
Flexible dashboards can save time and reduce the need to create separate reports for every stakeholder group.
Data visualization
Reports are more useful when people can quickly understand what they’re seeing.
Strong platforms make it easy to spot trends, compare performance, and share findings across teams.
Useful capabilities include:
- Clear charts and graphs
- Historical trend reporting
- Shareable dashboards and reports
Integrations
Learning data rarely lives in a single place.
Many organizations need to connect information from multiple systems to understand the full picture of learner performance and program outcomes.
Depending on your environment, that may include:
- Learning management systems (LMS)
- Human resource information systems (HRIS)
- Customer relationship management (CRM) platforms
- Assessment and certification tools
Connected systems can reduce manual reporting work and provide a more complete view of learner activity.
Ease of use
Analytics only helps when people can access and use it.
Strong platforms typically provide:
- Self-service reporting
- Minimal setup requirements
- Intuitive navigation
- Fewer spreadsheet exports
Teams are far more likely to use reporting tools consistently when answers are easy to find.
Scalability
Reporting needs often change as learning programs grow.
A platform that works for one audience or one program may become limiting as you add new courses, certifications, cohorts, customers, or business units.
Consider whether the platform can support:
- Multiple learner audiences
- Multiple programs or academies
- Growing learner populations
- Evolving reporting requirements
Before making a decision, ask a few practical questions:
- How quickly can reports be created?
- Which dashboards come pre-built?
- Can reports be customized?
- How are insights shared across teams?
- What data sources can be integrated?
- How much manual reporting work does the platform eliminate?
Those answers often reveal more about day-to-day usability than a feature list alone.
Teams comparing reporting and analytics capabilities across platforms can also review our guide to LMS analytics tools.
6 Top training analytics software platforms
The best platform depends on the type of learning program you’re running and the questions you’re trying to answer.
A customer education team may prioritize learner engagement and product adoption. A training academy may need cohort reporting and certification tracking. Internal L&D teams often focus on compliance, workforce development, and executive reporting.
Once you’ve identified the outcomes you need to measure, it’s much easier to narrow your options.
| Platform | Best for | Analytics strengths | Considerations |
| Thinkific | Learning businesses, customer education, training academies | Standard: completion tracking, learner progress, video engagement, revenue and enrollment reporting, and per-learner performance: all in one platform. Thinkific Plus (Advanced Analytics): fully custom dashboards, role-based access controls, and automated report delivery for teams reporting to multiple stakeholder groups. | Best fit for organizations delivering external learning experiences |
| LearnUpon | Employee training and customer education | Learner reporting, completion tracking, multi-audience reporting | Analytics depth may vary depending on reporting requirements |
| Docebo | Enterprise learning programs | Advanced reporting, large-scale learning operations | May be more complex than some organizations need |
| TalentLMS | Small and midsize organizations | Learner progress tracking, compliance visibility, and standard reporting | Focuses primarily on training management and reporting |
| Absorb LMS | Corporate learning and compliance | Dashboard reporting, learner analytics, performance tracking | Often geared toward internal training programs |
| Cornerstone | Large enterprise organizations | Workforce learning analytics, skills tracking, and compliance reporting | Typically suited to larger organizations with complex requirements |
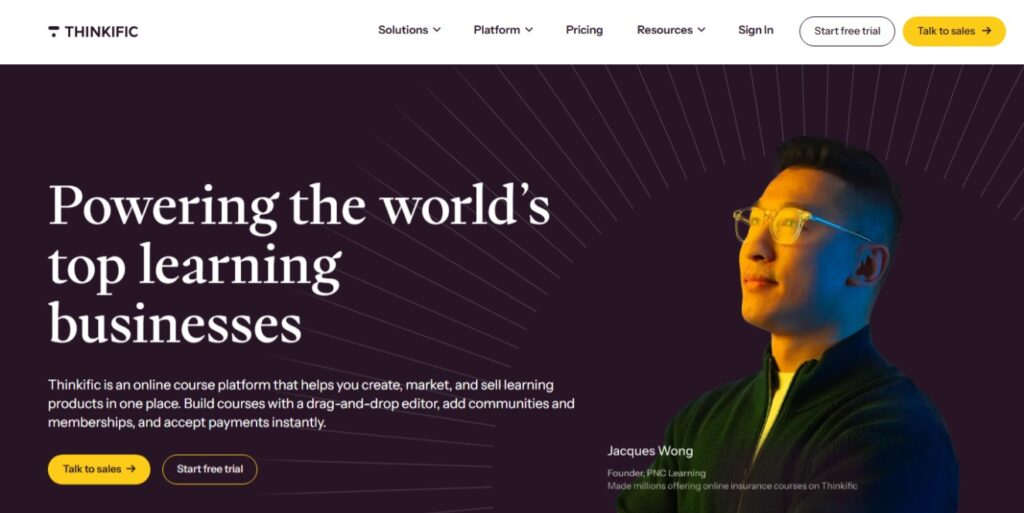
Thinkific is a digital learning platform designed for organizations that create, market, sell, and scale learning experiences. It supports customer education programs, professional training academies, certification programs, memberships, and learning businesses that want visibility into both learner performance and business outcomes.
Training analytics become most valuable when they help teams improve programs over time. Z-Health uses Thinkific’s analytics tools to monitor learner engagement and identify where learners need support, contributing to a reported 30–40% increase in course completion rates. Jelly Academy uses learner progress reporting to understand how learners move through its programs, while others may use analytics and reporting visibility to track learner activity across its financial services education offerings.
Each organization uses analytics differently, but the objective is similar: understand learner behavior, improve program performance, and demonstrate value.
Thinkific Analytics (included on all plans):
- Completion rates, video engagement, assessment performance, and learner progress dashboards
- Per-learner reporting across all courses and programs
- Revenue and enrollment reporting
- Community engagement tracking
- AI-powered analytics summaries
- Group and cohort management
- Integrations with business and marketing tools
Thinkific Plus: Advanced Analytics
- Designed for customer education at scale, multi-client reporting, and B2B training programs
- Build fully custom dashboards tailored to each stakeholder group
- Role-based access with row-level permissions, so each team sees only what’s relevant to them
- Automated report delivery via email, webhook, S3, or SFTP
LearnUpon is a learning management system built for employee training, customer education, and partner enablement. Organizations often use it to manage training across multiple audiences while tracking learner progress, assessments, certifications, and completions from a centralized platform.
Docebo is an enterprise learning platform designed for organizations with complex training operations. Its analytics capabilities support large-scale learning programs for employees, customers, partners, and the extended enterprise.
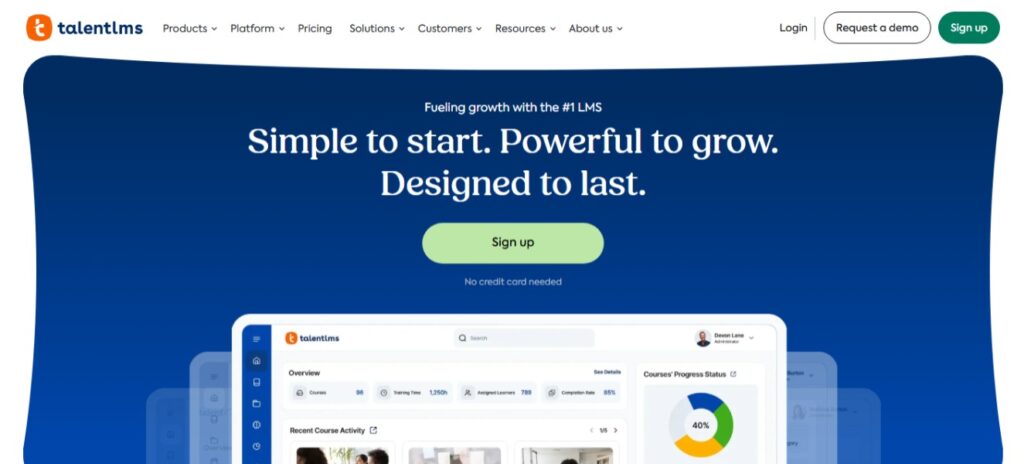
TalentLMS focuses on simplicity and ease of use. It is commonly used by smaller organizations that need learner tracking, assessment reporting, compliance visibility, and straightforward training administration.
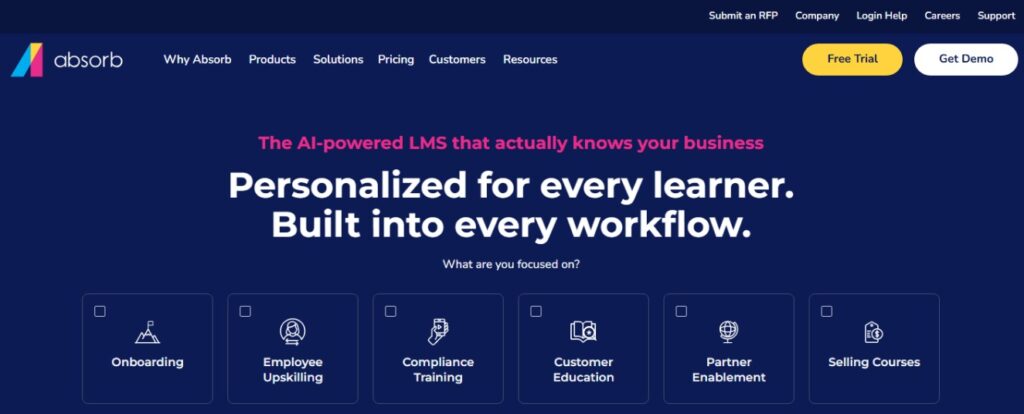
Absorb LMS is frequently used for workforce training, compliance initiatives, and professional development programs. Its reporting tools help teams monitor learner progress, certifications, and overall training performance.
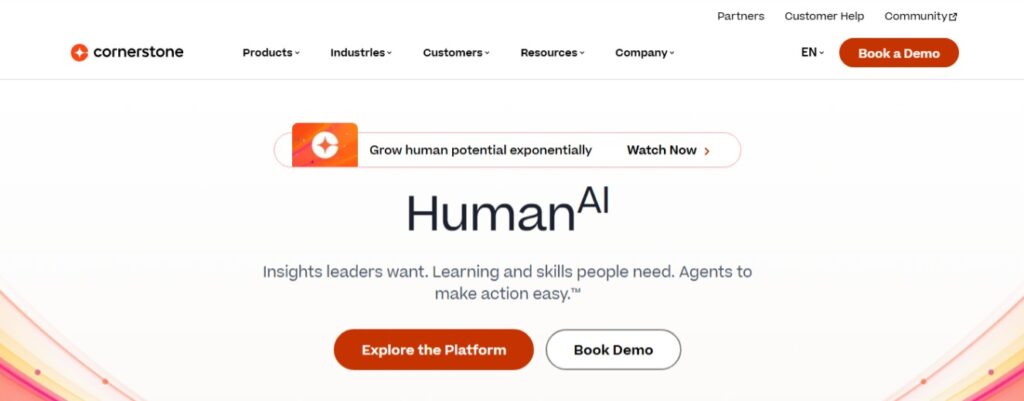
Cornerstone combines learning management, workforce development, and talent management. It is typically used by larger organizations that want learning analytics connected to broader workforce and skills initiatives.
How to choose the right training analytics software
The best platform depends on the questions you’re trying to answer.
A customer education team may want to understand which learning experiences drive engagement and product adoption. A training academy might need client-ready reporting across cohorts and certification programs. An L&D team may be focused on onboarding, compliance, or workforce development.
Start with the outcomes you want to measure. Then evaluate platforms based on how easily they help you track, report on, and improve those outcomes.
Start with the decision you need to make
Many organizations begin their search by comparing dashboards, reports, and feature lists.
A more useful starting point is identifying the decision your data needs to support.
For example:
- How can we improve onboarding completion?
- What will help increase certification rates?
- Where are learners dropping off?
- How can we demonstrate value to clients?
- Which learning experiences generate the strongest engagement?
Once you’ve identified the outcome that matters most, it becomes easier to evaluate which reporting and analytics capabilities are actually important.
That keeps the conversation focused on results rather than feature checklists.
Questions to ask before you choose
Before evaluating platforms, take a close look at how reporting works today.
A few questions can quickly highlight where friction exists:
- How much reporting is done manually?
- Who consumes the reports?
- How often are reports requested?
- Which outcomes matter most?
- Which systems need to share data?
The answers often reveal where teams spend the most time and where better analytics could have the greatest impact.
For example, a training company that regularly prepares client reports may prioritize dashboard flexibility and cohort reporting. A customer education team may place greater value on engagement tracking and learner-journey data.
Use reporting effort as a decision signal
The amount of effort required to produce reports can be a useful indicator of need.
Teams that rely on exports, spreadsheets, and manual updates often spend more time assembling information than acting on it. Strong analytics tools reduce that burden and make it easier to monitor performance on an ongoing basis.
Stakeholder expectations can provide another signal.
Leadership teams increasingly expect learning programs to demonstrate outcomes, whether that’s onboarding success, certification attainment, customer engagement, or training ROI.
The right platform should make those answers easier to find and easier to communicate.
See your learning data more clearly
Learning programs generate a steady stream of data about learner progress, engagement, certifications, and outcomes.
The gap isn’t in the data: it’s in the time it takes to turn that data into something useful. Teams that spend hours assembling reports from spreadsheets and exports aren’t making better decisions; they’re just making the same decisions later. The right analytics platform closes that gap, so the insight is ready when the question gets asked.
That’s the difference between a learning program that can demonstrate its value and one that hopes the results speak for themselves.
Put your training data to work with Thinkific
Thinkific Analytics gives learning teams a real-time view of learner progress, completion rates, video engagement, assessment performance, and revenue in one place, so the data your program already generates becomes something you can act on. For teams running customer education at scale, reporting to multiple stakeholder groups, or managing multi-client programs, Thinkific Plus adds Advanced Analytics: fully custom dashboards, role-based access so each audience sees what’s relevant to them, and automated report delivery so executives and clients stay informed without manual effort on your end.
Start a free Thinkific trial to see how the analytics dashboards work firsthand, or book a demo with the Thinkific Plus team if you need advanced reporting and custom dashboards for a larger training organization or customer education program.