

If you run training programs, there’ll come a point where you have to justify the spend to leadership. And when that time comes, saying “the program is working” won’t cut it. You’ll need hard figures to convince the C-suite that the training programs drive results and that they should keep investing in them.
The figure that underscores your case is the training ROI.
In this article, we’ll cover (skip ahead):
- What training ROI is, and why it’s difficult to calculate
- The difference between training ROI and training impact
- The inputs you need to calculate training ROI
- The training ROI formula and how to apply it
- A 5-step training ROI template
- Common mistakes to avoid when calculating training ROI
- Frequently Asked Questions
What is training ROI, and why is it so hard to calculate?
Training ROI is the financial return your training program generates compared to what it costs to run. Put simply, it answers the question leadership asks: “For every dollar we put into training, what did we get back?”
When you calculate training ROI, it can tell your team and leadership:
- Whether a program is worth the money you’re spending on it
- Which programs deserve more investment, and which ones should be scrapped (or reworked)
- How training connects to outcomes the business cares about, like retention or revenue
- Where to set a baseline so you can show improvement over time
However, the math involved in calculating training ROI is not as simple as “the money the training brought in minus the cost of building it.” This simplistic version leaves out many factors involved in setting up and running a training program, and any leader who looks closely will spot the gaps right away.
There are two main reasons calculating training ROI is challenging:
- Disconnected teams and tools. To calculate ROI, you need three types of data, but they’re usually stored in different tools owned by different teams that don’t always talk to each other:
- Cost data: This covers what you spent to build and run the program, as well as the money generated through enrollments or sales (if you offer paid programs). This data usually lives in tools like QuickBooks, NetSuite, or a budgeting spreadsheet used by the finance team.
- Outcome data: This represents the measurable results that trainees achieve after completing the program, such as faster ramp time, increased purchases, retention and adoption, fewer errors, or higher close rates and upsells. This is usually analyzed by the operations team.
- Learning data: This measures how learners engage with the training material, including their progress, completion rates, and assessment scores. This information is usually stored in the LMS and handled by program managers.
When you can’t bring your cost, outcome, and learning data together, you don’t get the full picture, and it’s hard to say with any confidence whether a program is paying off.
- Training rarely moves a business metric on its own. Say your sales team closes more deals after taking a new training program. That’s encouraging, but you can’t be 100% sure the training caused it.
Maybe the market improved, or you hired stronger reps, or you increased how much reps get paid. Any of these could have lifted your win rate, too, so giving the training program all the credit overstates your case and invites others to question your numbers.
Still, this doesn’t mean you should give up on determining your training ROI. There’s a way to work around these difficulties and get a figure you can defend, though it’ll likely be an estimate rather than a hard, set-in-stone result.
And that’s fine.
A defensible estimate beats having no number at all. It gives leadership something concrete to respond to and your team a baseline to measure against and improve on.
👉 Read: LMS Analytics: How to Use Data to Drive Smarter Learning & Business Decisions
Training ROI vs. training impact: What’s the difference?
Before we get into the nitty-gritty of calculating training ROI, let’s establish the difference between two terms that often get used interchangeably but mean different things: training ROI and training impact.
- Training ROI is a financial return, expressed in dollars or a percentage. It’s the metric a CFO responds to, because it speaks the language of “money in” and “money out”.
- Training impact, on the other hand, is broader and covers the overall impact that training had on business outcomes such as: performance gains, engagement, confidence, and retention. These matter just as much, but it is more complex to reduce them to a clean dollar figure. If you want to learn a simple framework to measure this, we have a helpful guide to get you started.
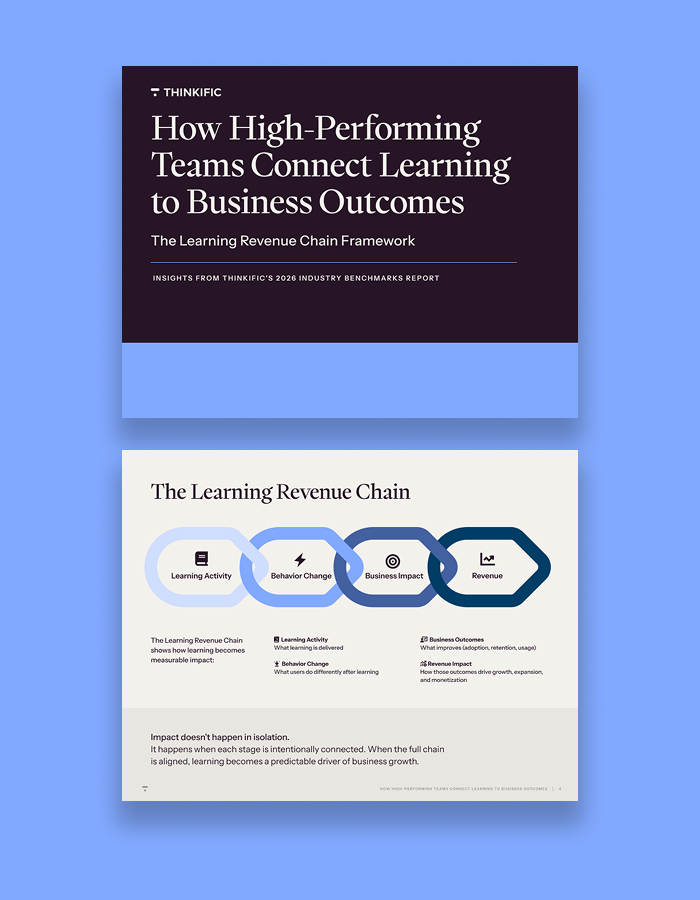
Learn how high-performing teams connect learning to business outcomes
98% of organizations say education impacts revenue, yet fewer than 1 in 3 can prove it. (Thinkific Benchmarks Report, 2026)
This guide explains why that gap exists: and gives you a practical framework for closing it.
This article focuses on the financial side: training ROI. However, the two aren’t competitors, and you don’t have to pick one.
If you’re trying to get buy-in to expand your learning program, the best move is to bring both training ROI and training impact to the table.
The ROI number gives leadership the financial proof they want, and the impact data shows the human results behind it, like more confident employees or learners who stick around.
Together, they cover both the side that convinces the C-suite and the side that explains why the program works in the first place.
The inputs you need before calculating training ROI
To calculate training ROI, you need two things: what your program costs and what it produces. The more accurate you are with both, the better your final number will hold up when someone asks you to prove it.
Program costs
Program costs are the total amount it took to build and run your learning program. The mistake many teams make is counting only the obvious line items and skipping the hidden ones, which makes the program look cheaper than it actually is.
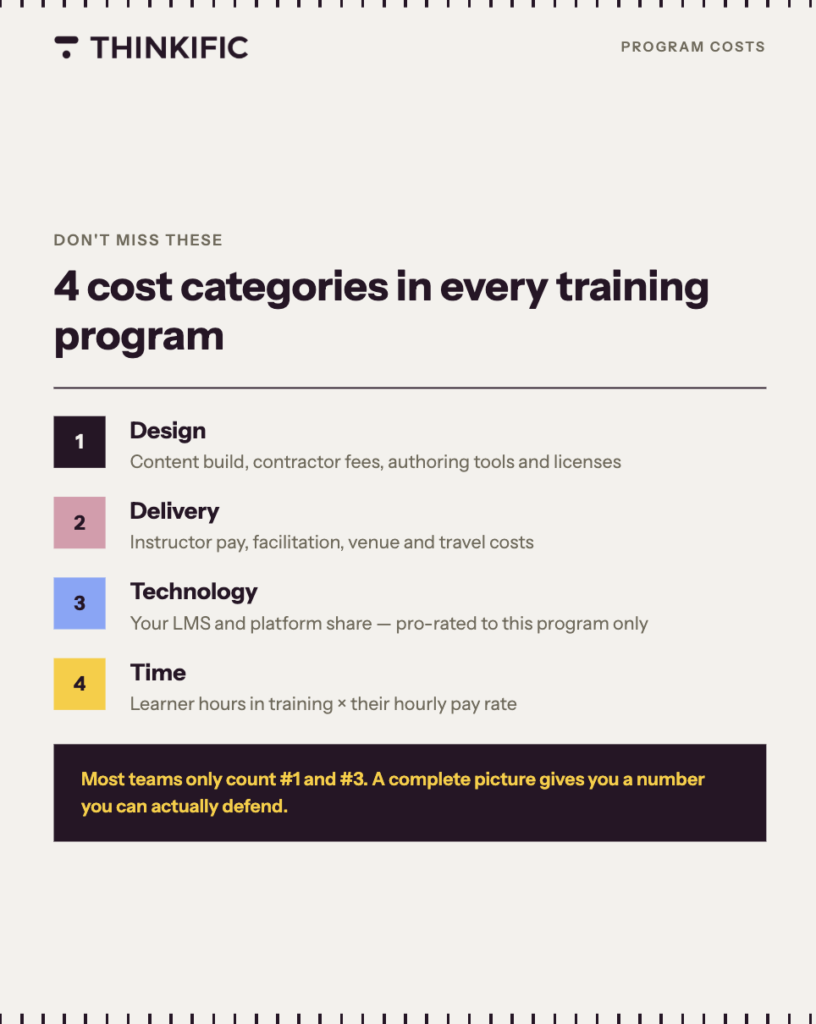
To get an accurate total, work through these four categories:
- Design: This is what you spend to create the training program. It includes the amount paid to your team or contractors to build the content, fees for any subject-matter experts you bring in, and the cost of tools or licenses used to produce the material. For example, if a contractor charges $8,000 to build a course and you spend $500 on authoring software, your design cost is $8,500.
- Delivery: This is what it costs to actually run the program. For live training, that means instructor pay, facilitation, and any venue or travel costs. For self-paced programs, the cost is lower, but you still factor in the hours your team spends administering the program and supporting learners.
So if an instructor is paid $3,000 total to run six sessions in a venue that costs $200 per session, the total delivery cost is $4,200. - Technology: This is what you pay for the platforms that host and run your program, e.g., your learning management system (LMS), assessment tool, and certification management software.
Use only the cost percentage that applies to the specific program you’re calculating for, not your full annual software bill. For example, if your LMS costs $6,000 a year and this program is one of four running on it, then the cost is $1,500. - Time. This is the category teams most often leave out. It covers the cost of the hours trainees spend in the program rather than in their regular jobs (if they’re employees). For example, if 20 employees each spend 5 hours on a training program and their average pay is $40 an hour, that’s 100 hours total, or $4,000 in learner time alone.
Once you have all four categories, add them together for your total program cost. Using the examples above, that’s $8,500 + $4,200 + $1,500 + $4,000, for a total of $18,200.
Outcome metrics
Outcome metrics are the measurable results that learners produce after completing the program. This is the return side of the calculation, and your job is to translate each metric into a dollar value you can defend.
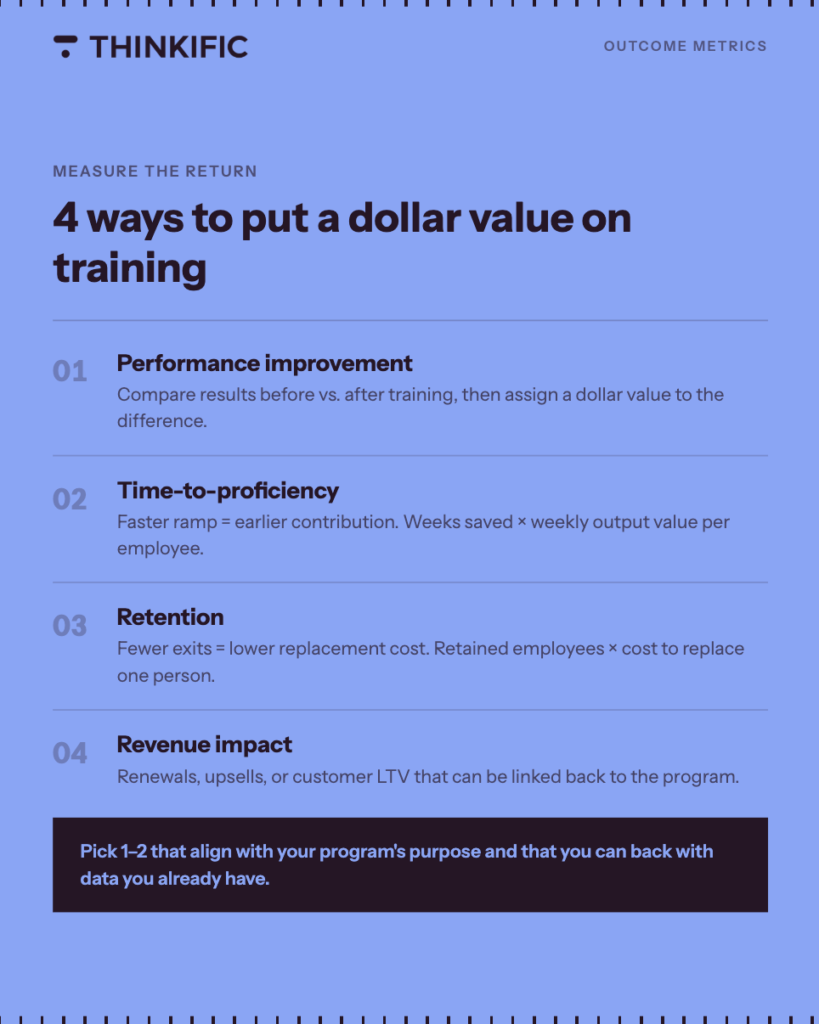
Here are four to consider:
- Performance improvement. This is a noticeable lift in how well people do their jobs, such as higher sales, fewer errors, or faster resolution times. Start by comparing performance before and after training, then work out what that difference is worth in dollars.
For example, if trained reps each close 2 more deals per month at an average deal size of $1,000, that’s $2,000 in additional revenue per rep each month. - Time-to-proficiency. This is how long it takes a new hire to reach full productivity. A training program that shortens it means people start contributing sooner.
For example, if a new hire normally takes 12 weeks to ramp up and training cuts that to 9 weeks, you’ve gained 3 weeks of output. If their work is worth about $1,500 a week, that’s $4,500 in value per new hire. - Retention. This measures whether people stay with the company longer after going through the program.
Replacing an employee is expensive once you factor in recruiting, onboarding, and lost productivity. So, if training helps you retain five employees who would otherwise have left, and replacing one costs around $10,000, then you’ve saved $50,000. - Revenue impact. This is income you can tie back to the program, like upsells from a customer education academy or higher renewal rates among trained customers. For example, if trained customers renew at a rate that generates an extra $20,000 per year, that’s your revenue impact.
Be honest about where these estimates get fuzzy. Some, like revenue impact, are fairly direct, while others, like performance improvement, depend on assumptions about how much of the change the training actually caused.
That’s fine, as long as you state those assumptions and apply them the same way each time.
💡 Pro tip: You don’t need all four. Pick the 1–2 outcome metrics that matter most for your program and that you can back with data you already have.
The training ROI formula (with worked examples)
Once you have your costs and your outcome metric(s), use this formula to calculate your training ROI:
ROI % = ((Program Benefit − Program Cost) / Program Cost) × 100
- Program cost is the sum of your four cost categories: design, delivery, technology, and time.
- Program benefit is the dollar value of the outcome metric(s) you chose, e.g., the value of faster ramp time or improved retention.
Let’s walk through two examples so you can see how the numbers come together, then swap in your own.
Example 1: An instructor-led onboarding program
Say you run a sales onboarding program led by an instructor. Last quarter, you put 8 new reps through it, and you want to know whether it paid off.
First, add up the program cost across the four categories:
- Design: $10,000 to build the course and training materials
- Delivery: $6,000 for instructor time across the sessions
- Technology: $2,000 for this program’s share of your LMS
- Time: $5,600 for the hours the 8 reps spent in training instead of selling
That brings your total program cost to $23,600.
Next, calculate the benefit. You choose time-to-proficiency as your outcome metric, since onboarding is about getting reps productive faster:
- New reps used to take 14 weeks to reach full productivity.
- After the program, they reach it in 10 weeks.
- That’s 4 weeks of productivity gained per rep.
- Each rep brings in an average of $1,800 per week once they’re ramped.
So each rep delivers 4 × $1,800 = $7,200 in extra value per month. Across all 8 reps, that’s $57,600. This is your program benefit.
Now put both numbers into the formula:
ROI % = (($57,600 − $23,600) / $23,600) × 100
ROI % = ($34,000 / $23,600) × 100
ROI % = 144%
In plain terms, the program returned about $1.44 in net gain for every dollar you spent.
Example 2: A self-paced customer education program
Now, say you run a self-paced academy that teaches customers how to use your product. There’s no instructor, so your delivery cost is lower, but you’re tracking a different business outcome: renewals.
First, the program cost:
- Design: $12,000 to build the course library
- Delivery: $1,500 for the time the team spent administering and supporting learners
- Technology: $3,500 for this program’s share of your LMS and assessment tool
- Time: $0, since customers take the program on their own time rather than company time
That brings your total program cost to $17,000.
Next, is where the impact portion of ROI measurement comes in: quantifying the benefit of the training and tying it to a business outcome. For the purpose of this example, let’s say you choose revenue impact as your outcome metric, measured through customer renewals:
- 50 customers completed the program this year.
- Trained customers renew at a higher rate than untrained ones.
- That higher renewal rate works out to 6 additional customers retained.
- Each retained customer is worth $4,000 a year in renewal revenue.
So, the benefit is 6 × $4,000 = $24,000. This is your program benefit.
Now put both numbers into the formula:
ROI % = (($24,000 − $17,000) / $17,000) × 100
ROI % = ($7,000 / $17,000) × 100
ROI % = 41%
This means that the program returned about $0.41 in net gain for every dollar you spent.
👉 Read: The Link Between Customer Renewals and Education
The 5-step training ROI template
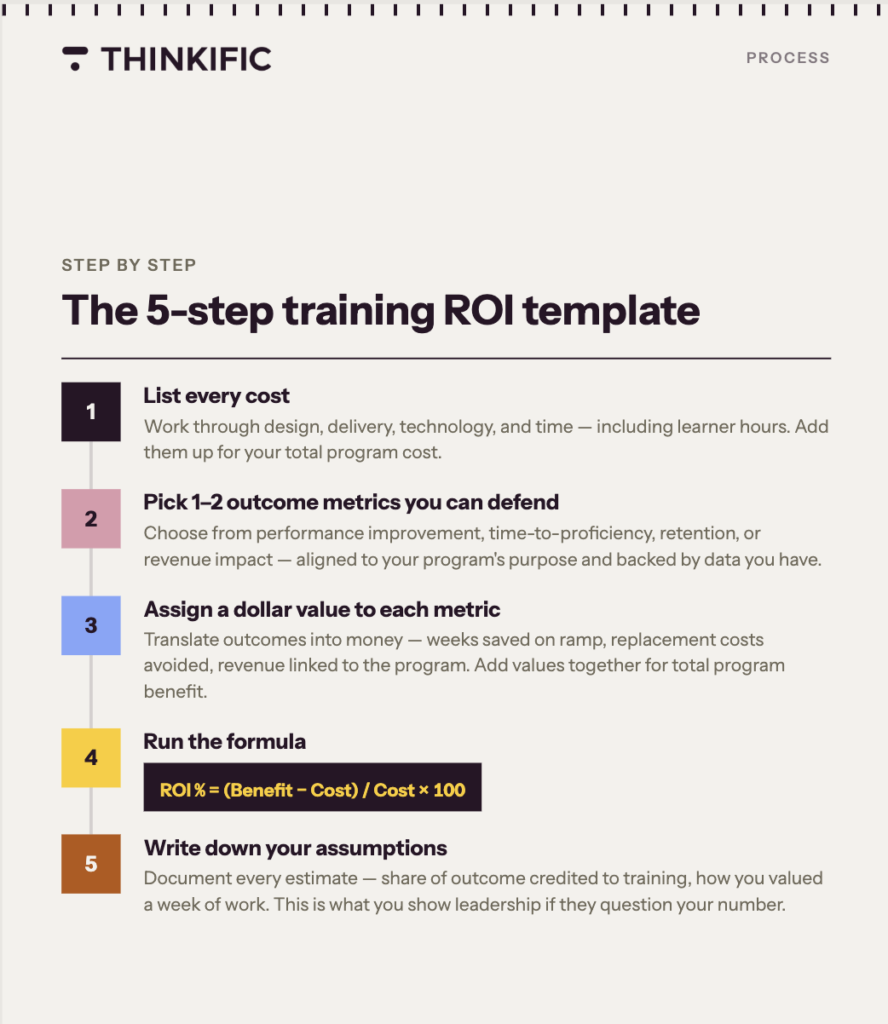
Whatever program you’re measuring, the process for calculating training ROI is the same. Here are the five steps:
- List every cost. Work through the four categories: design, delivery, technology, and time. Don’t skip the less obvious ones, especially the hours learners spend on the program (if the program is for employees). Add them up for your total program cost.
- Pick one or two outcome metrics you can defend. You can either choose from performance improvement, time-to-proficiency, retention, and revenue impact, or pick a different metric (we cover more options below). Just ensure that your chosen outcome metrics align with your program’s purpose and can be supported by the data you already have.
- Assign a dollar value to each metric you chose. Work out what each outcome is worth in monetary terms, such as the value of the weeks saved on ramp time or the replacement cost you avoid by retaining an employee. If you chose two metrics, add their values together for your total program benefit.
- Run the formula. Plug your two numbers into ROI % = (Program Benefit − Program Cost) / Program Cost × 100 to get your return as a percentage.
- Write down your assumptions. Don’t skip this step. Note every estimate behind your number, such as how much of the outcome you credited to training or the dollar value you placed on a week of work. If leadership and/or the finance team questions your number(s), your written assumptions explain where those figures came from.
Choosing the right outcome metrics for your training type
The training ROI formula only works well if you measure the right outcome. The four metrics we covered earlier (performance improvement, time-to-proficiency, retention, and revenue impact) apply broadly, but the best metric for a given program depends on that program’s goal/purpose.
Want help tying your learning program to business outcomes, and KPIs? We have a template for that. You can download it below:
Below are four common program types and some of the metrics that apply to each, to help spark some ideas that you can use in the KPI mapping template.
1. Onboarding programs
Onboarding training helps new hires learn their role and start contributing as quickly as possible. The return comes from people reaching full productivity sooner and staying with the company longer. Useful metrics include:
- Time-to-proficiency: This measures the time it takes a new hire to reach full productivity. A shorter ramp time means they start contributing sooner, which has a clear dollar value.
- Early-tenure retention: This measures the share of new hires who remain with the company after their first 6 or 12 months. Better retention means you spend less on replacing people who leave early.
- Time to first result: This measures how quickly a new hire completes a key task for their role, e.g., a sales rep closing their first deal, or a support agent resolving their first ticket.
2. Compliance programs
Compliance training ensures that employees follow the rules, regulations, and policies that apply to their work. The return here is mostly about the cost(s) you avoid, since the goal is to prevent problems before they happen.
Track metrics like:
- Incident rate: This is the number of violations, safety incidents, or policy breaches recorded before and after training. Fewer incidents mean lower risk and lower costs associated with them.
- Audit results: This reflects how the team performs in audits or inspections. Passing an audit you might otherwise have failed helps you avoid fines and penalties.
- Cost of non-compliance avoided: This is the estimated cost of the fines, legal fees, or downtime you prevent by keeping employees compliant.
- Completion rate: This is the share of required employees who finish the training on time. For compliance, full completion is often a legal requirement.
3. Professional development programs
Professional development training helps existing employees build new skills and grow in their careers. The return comes from better performance and from retaining and promoting the people you already have, rather than hiring new ones. Consider metrics like:
- Performance improvement: This is the measurable gain in how well employees perform their jobs after training, such as higher output or better-quality work.
- Promotion rate: This is the share of employees who move into more senior roles after completing the program. Promoting from within usually costs less than hiring externally.
- Reduced backfill hiring: This is the savings you gain from filling roles internally instead of recruiting outside candidates, which carry recruiting and onboarding costs.
- Retention: This tracks whether employees s who receive development training stay longer, since access to growth often makes people less likely to leave.
4. Customer education programs
Customer education training teaches your customers how to use your product successfully. The return shows up in how customers use the product, how long they stay, and whether they renew their subscriptions. Focus on metrics like:
- Product adoption: This measures how much trained customers use your product compared to untrained ones, tracked through logins, feature use, or active days.
- Customer retention: This is the length of time trained customers stay with your company. Customers who understand your product are less likely to churn.
- Renewal rate: This is the share of trained customers who renew their contracts or subscriptions. Higher renewals tie directly to revenue.
- Support ticket volume: This is the number of support requests that trained customers submit. Fewer tickets means lower support costs, since educated customers solve more problems on their own.
👉 Read: How To Improve Retention Through Customer Education
Common pitfalls when calculating training ROI (and how to avoid them)
Here are a few common errors that can weaken your training ROI number and make it harder to defend.
- Overclaiming outcomes
When a metric improves, it’s tempting to give your training program credit for it. But when sales rise, or errors drop, training is usually one of several factors at play. If you credit the program with all of it, the number becomes easy to question.
The fix: Give your program credit for a realistic share of the outcomes rather than the whole thing. If you believe training drove part of the improvement, estimate that portion and note your reasoning. A smaller number you can defend is more useful than a large one you can’t. - Ignoring indirect costs
Design and technology costs are easy to spot, so they usually make it into the calculation. The costs that get missed are the indirect ones, like the hours learners spend taking the program rather than working (provided the learners are employees). Leaving these out makes the program look cheaper than it was and inflates your ROI.
The fix: Include the time costs alongside the obvious expenses. Count the hours employees spend on the program and assign them a dollar value based on pay. A complete cost picture gives you a number that holds up. - Using metrics that leadership doesn’t care about
Sometimes you’ll pick a metric because it’s easy to measure, only to find that leadership doesn’t consider it important. Having a number that doesn’t reflect the business’s priorities won’t change the conversation, no matter how strong it looks.
The fix: Before you calculate, identify which outcomes leadership already cares about, such as revenue, retention, or risk. Then choose metrics that align with those priorities, so your numbers speak to what your audience values. - Measuring too soon
Many training outcomes, like retention and promotion rate, take time to show up. If you calculate ROI right after a training program ends, you might capture costs before the benefits have had a chance to appear, which can make a good program look like a poor investment.
The fix: Give the outcome enough time to develop before you measure it. Decide in advance when results should reasonably appear, whether that’s in a quarter or in a year, and calculate your ROI then. - Comparing ROI across dissimilar programs
It’s natural to want to rank your programs against each other, but a compliance program and a sales onboarding program produce very different kinds of returns. Comparing their ROI percentages directly can lead to unfair conclusions and budget cuts for programs that are actually working.
The fix: Compare each program to its own past performance rather than to unrelated programs. Tracking how one program’s ROI changes over time tells you far more than measuring it against a program with a different purpose.
Calculate your training ROI with Thinkific
A training ROI calculation depends on three types of data: cost data, outcome data, and learning data. The LMS you use to structure and deliver your training program is where you’ll find the learning data, including course completions, learner progress, and assessment scores.
Thinkific lets you see that data at a glance through its advanced analytics. You can track enrollments, completion rates, engagement, and assessment results, build custom dashboards, and compile reports for stakeholders.
Thinkific also integrates with popular accounting tools like QuickBooks and Xero, so you can pull in your cost data, too. Instead of relying on guesswork, you’ll have all the information you need to calculate a return you’re confident in.
If you’d like to see how Thinkific works, start a free trial or book a demo today to learn more about Thinkific Plus for larger companies and enterprises.
Frequently Asked Questions
1. How long after a program should you wait before measuring ROI?
It depends on how quickly the outcome you’re measuring tends to appear. Some results, like completion rates or assessment scores, show up right away. Others, like retention, promotions, or revenue, take months to develop.
As a general guide, wait at least one full quarter after a program ends before calculating ROI, and longer for outcomes tied to career growth or customer renewals.
2. Can you calculate ROI for a program that hasn’t launched yet?
Yes, but it will be a forecast rather than a measurement. A forecast estimates the return you expect based on assumptions: how many people will go through the program, what outcomes you expect, and what those outcomes are worth. This is useful when you’re proposing a new program and need to justify the budget before it exists.
Once the program launches and you have actual data, you can calculate the actual ROI and compare it to your forecast.
3. What counts as a good training ROI percentage?
There’s no universal benchmark, and you should be cautious about any number presented as one. A “good” ROI varies widely by program type, industry, and what you choose to measure. A compliance program and a sales onboarding program produce very different returns, so comparing them to the same target doesn’t make sense.
Rather than chasing an industry figure, focus on two things: whether your ROI is positive (the benefit outweighs the cost), and whether it improves over time. Your own trend line is far more meaningful than a benchmark from another company that measures different things.
4. Do you need dedicated analytics software to measure training ROI?
No. You can calculate training ROI in a spreadsheet, and many teams do exactly that. The formula is simple, and a spreadsheet is enough to total your costs, record your outcome metric, and apply the calculation.
That said, dedicated software helps you get the data you need. For example, LMS’s like Thinkific store your learning data and outcome metrics, and accounting tools like QuickBooks store your cost/expense data.