

Analytics are a seemingly common feature in any learning management system (LMS), but the depth, usability, and quality of data insights are the difference makers that make one LMS analytics tool shine over another.
The difference matters more than it used to. According to the LinkedIn 2025 Workplace Learning Report, 49% of L&D professionals say their executives are concerned that employees don’t have the right skills to execute business strategy. When the pressure to prove training impact is coming from the top, a dashboard full of login counts is not going to cut it.
This guide breaks down what strong LMS analytics actually looks like, what to watch for when evaluating platforms, and how leading tools compare on reporting.
Already know what you’re looking for? Jump to it here!
- What are LMS analytics tools?
- Why your current LMS data reporting tools are failing you
- Who uses reports in the LMS
- Core features every LMS should include
- Basic vs. advanced analytics in an LMS
- Examples of top LMS analytics platforms
- Short buyer’s checklist
- How AI is changing compliance reporting
- Conclusion
What are LMS analytics tools?
LMS analytics tools are the reporting and data features built into a learning management system that let training teams track what is happening inside their learning programs.
- At a basic level, it enables tracking who enrolled, who completed a course, and what scores they earned.
- At a more advanced level, it builds an understanding of which content is driving real behavior change, which learner groups are falling behind, and how training outcomes connect to business results.
The difference between a reporting tool and an LMS analytics dashboard
These two terms get used interchangeably in most LMS evaluations, but they describe fundamentally different things.
- A report is something you run when a specific question comes up, pulling data on demand for a presentation, an audit, or a business review.
- An analytics dashboard is something you live in daily, giving you a persistent, real-time view of what is happening across your programs without having to go looking for it.
Why your current LMS data reporting tools are failing you
Most LMS platforms include some form of analytics out of the box. But there is often a significant gap between what legacy platform analytics and what your team can actually do with the data. For example:
1. Time-consuming investigations
For example, here is a scenario that plays out in a lot of training programs. It starts with leadership asking for a program summary ahead of a business review. Then, the L&D manager opens the LMS, pulls what data is available, exports it to a spreadsheet, cross-references enrollment records from another tab, builds a summary slide, and spends up to a full day on something that should have taken twenty minutes.
The time sink of a manual reporting process holds back quarterly business reviews where learning and enablement leaders are asked to prove program ROI, creates delays in compliance audits requiring documentation of who completed what and when, and builds doubt when pitching new training initiatives that need to show results fast.
2. Vanity metrics
Some LMS dashboards are designed to look impressive in a demo rather than answer real operational questions. Total enrollments, overall completion rates, and average login frequency are easy numbers to surface, but they rarely tell you anything actionable. If your platform leads with those metrics and makes it hard to get to question-level assessment data, cohort comparisons, or content drop-off points, the dashboard is not actually helping you understand if content is sticking.
A deeper problem is when you’re unable to prove the value of your program to senior leadership teams. If your LMS cannot connect training completion to business outcomes like product adoption, customer retention, or sales performance, enablement teams will lose credibility.
3. Restrictive reporting
Many LMS platforms limit reporting to a fixed set of fields and templates. You can see what the platform was built to show you, but not necessarily what your business needs to know. If answering a specific stakeholder question requires a custom data export, a workaround, or a request to your IT team, that is a sign the reporting layer was built for compliance rather than usability. The best platforms let administrators build and schedule reports around their own metrics without technical support.
Who actually uses reports in the LMS?
The best LMS performance tracking platforms are able to serve unique insights that are most valuable to the different groups that are working in the tool, including:
| Group | Purpose | Favourite reports | Shares dashboard with |
| Enablement leaders | Track whether teams are following the program and progressing as expected | Learner progress, completion trends, drop-off rates | Executives, operations leads |
| Learning designers and instructional designers | Evaluate whether content is landing and identify where learners are losing momentum | Assessment data, question-level performance, content drop-off points | Enablement leaders |
| Executives and department heads | Confirm that training is connected to business outcomes without logging into the platform | Program-level summaries, ROI reports delivered by email | Enablement leaders, compliance managers |
| Compliance managers and auditors | Access properly formatted completion records quickly to verify and prove compliance | Timestamped completion records, certification status reports | Executives, operational leaders |
| Operations and IT leaders | Maintain data integrity and ensure reporting connects to broader business tools | Integration health, data export logs, system reliability reports | Enablement leaders |
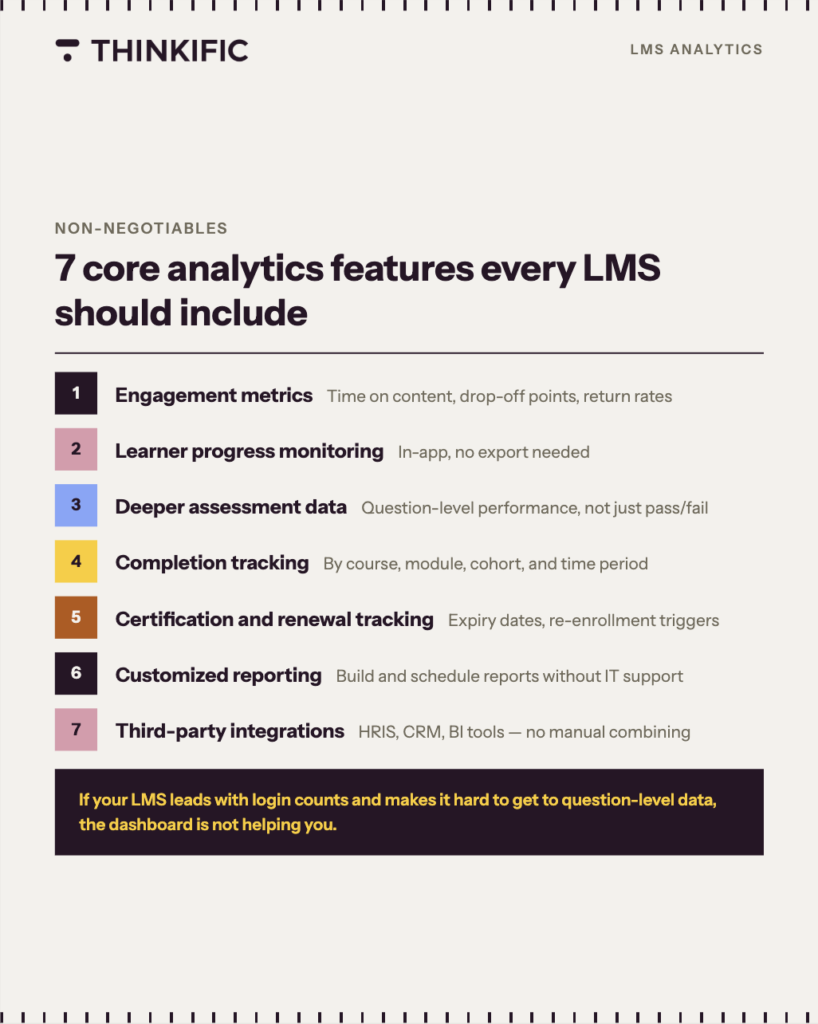
7 Core analytics features every LMS should include
Not all LMS analytics features are created equal. Before evaluating advanced capabilities, make sure any platform you’re considering covers these fundamentals well.
- Engagement metrics
Enrollment and completion numbers tell you whether learners started and finished. Engagement metrics tell you what happened in between. Look for platforms that surface time spent on content, video drop-off points, return visit rates, and activity patterns. These data points are what help you distinguish between a course that learners are genuinely working through and one they are clicking past to get a certificate.
- Learner progress monitoring
You should be able to see where any individual learner stands in a course at any point in time, without exporting data to find it. Progress monitoring is how training administrators identify learners who are falling behind before they disengage entirely.
- Deeper assessment data
Modern assessment analytics go far beyond pass or fail rates. The best platforms will give you question-level performance data, so you can see exactly where knowledge gaps exist across your cohort. For example, if 60% of your team is getting one specific question wrong, that signals that the content or delivery is just not landing with the majority of your learners and needs to be reconfigured.
- Completion tracking
Completion tracking sounds basic, but there is a meaningful difference between a platform that shows you a total completion count and one that shows you completion rates by course, module, program, cohort, and time period. The latter lets you compare performance across teams, identify which programs are underperforming, and track trends over time. If your LMS only gives you a headcount of who finished, you are starting from a very limited baseline.
- Certification and renewal tracking
For any program that issues certificates or requires learners to maintain credentials over time, the LMS should track not just who earned a certification but when it expires and whether it has been renewed. This is distinct from basic completion tracking. A learner who completed a course two years ago and never renewed is not compliant and may pose a risk to their organization or career (e.g. nurses, financial advisors, construction workers).
- Customized reporting
Custom reporting is the ability to build unique reports around your own business metrics, not just the default fields. Scheduled reporting takes it further by delivering those reports automatically to the right stakeholders at the right cadence, so leadership gets what they need without someone having to run the report each time. This should save a lot of time by automating the delivery of important insights. Make sure you are able to build both of these on your own (self-serve), so that you can customize on the fly as business needs change.
- Integration with third-party tools
Learner data becomes significantly more valuable when it sits alongside other business data. An LMS that integrates with your HRIS, CRM, or BI tools allows your team to cross-reference training completion against performance reviews, sales results, or headcount changes without manually combining exports. This is what makes it possible to answer questions like whether your top performers completed a specific program, for example.
Thinkific Analytics is built for exactly this kind of connected reporting. On any Thinkific plan, training and customer education teams get revenue dashboards showing top products, trends, ARPU, and subscription health; enrollment and order reporting across courses, bundles, memberships, and communities; funnel reporting connecting landing page activity, lead magnet performance, and checkout behavior; and engagement and completion data tied to business outcomes, with no separate BI build required. For teams running more complex programs on Thinkific Plus, Advanced Analytics goes further: build fully custom dashboards for executives, instructors, account managers, and B2B clients; set role-based access with row-level permissions so each stakeholder group sees only what’s relevant to them; and automate report delivery via email, webhook, S3, or SFTP so the right people stay informed without manual exports.
Basic vs. advanced reporting in an LMS
Most training teams start with basic reporting and assume they will grow into advanced features later. The right level of reporting depends on your program’s complexity and your stakeholder requirements. Knowing where your program stands today and where it could be headed helps narrow down which capabilities actually matter in an evaluation.
Basic reporting
Basic reporting in an LMS only tells you what happens. It is useful as a starting point but does not provide context on why something happened or what to do about it.
Typically, you can expect to see:
- Course completion rates by individual and program
- Enrollment and registration counts
- Quiz scores and pass or fail status
- Login frequency and time-on-platform data
- Certification issuance records
- Standard out-of-the-box report templates
Advanced reporting
Advanced reporting moves into the diagnostic, predictive, and prescriptive layers. It helps teams understand patterns, anticipate problems, and connect learning data to business outcomes.
- Cohort analysis comparing performance across teams, roles, hire cohorts, or regions
- HRIS and BI integrations that let learning data live alongside HR performance or business metrics in tools like Workday, Salesforce, or Tableau
- Learner segmentation allowing you to filter and analyze data by role, department, manager, certification status, or program cohort
- Automated report scheduling that delivers summaries to stakeholders without manual effort
- Revenue and outcome dashboards for teams running external academies or customer education programs, connecting training data to business results
- Predictive flags that surface at-risk learners before they disengage, based on behavioral signals
Thinkific Analytics covers the full advanced reporting range above for most training and customer education programs: cohort filtering, HRIS and BI integrations, learner segmentation, automated scheduling, and revenue dashboards that connect learning activity to business outcomes. Teams on Thinkific Plus unlock Advanced Analytics for more complex reporting scenarios: build fully custom dashboards from flexible layouts rather than fixed templates, define custom KPIs aligned to internal targets or client contracts, control access with role-based and row-level permissions, and schedule automated report delivery via email, webhook, S3, or SFTP.
Examples of top LMS analytics platforms
To help you get started with finding the best LMS analytics platforms, we’ve summarized five top tools here.
| Platform | G2 Score | What makes it stand out |
| Thinkific Plus Advanced Analytics | 4.5 | Connects learning activity to revenue, enrollment, and engagement in one place. |
| TalentLMS | 4.6 | Strong core reporting for small businesses |
| Docebo | 4.4 | Ideal for pushing data into third-party BI tools |
| AbsorbLMS | 4.6 | AI automates compliance tracking and real-time audit reporting |
| 360Learning | 4.6 | Best engagement data for peer-driven programs |
Short buyer’s checklist for LMS analytics
Feature lists can look impressive in a demo and disappoint in practice. Before committing to a platform, use these questions to stress-test what you’re actually getting.
- Can non-technical users run reports without IT support?
- Does the platform show learner progress in-app, without a data export?
- Can you schedule reports to specific (or multiple) stakeholders automatically?
- Does it connect to your existing HRIS or BI tools natively?
- Can you filter data by team, role, cohort, or region?
- Are compliance reports generated instantly or assembled manually?
- Does AI flag at-risk learners before they disengage or lapse?
- Can you build custom reports without a developer or analyst?
- Does the dashboard serve multiple stakeholder views in one platform?
Thinkific Analytics addresses these questions across all plans, including self-serve reporting, in-app learner progress, scheduled delivery, native integrations, and cohort filtering. For teams managing multi-stakeholder programs, B2B client reporting, or enterprise training at scale, Thinkific Plus and Advanced Analytics add custom dashboard layouts, row-level role access, and automated delivery to each stakeholder group without manual exports.
How AI in your LMS turns compliance tracking into a reporting advantage
Compliance training has always had challenges around reporting and documentation. It’s easy enough for most teams to complete their work, but it becomes difficult for managers and HR to prove to an auditor or regulator that the right people completed the right training at the right time, and that their credentials are still current.
Organizations implementing AI-powered compliance training are now reporting 40% reductions in training time and significant decreases in compliance violations, and much of that gain comes from automating the reporting aspect.
AI is improving LMS performance tracking and positively impacting compliance tracking through two methods:
- Certification expiry and renewal tracking: AI monitors certification expiry across an entire learner base and triggers automated re-enrollment or reminder sequences at configurable intervals, whether that is 90 days before expiry, 30 days, or at the point of lapse. This eliminates the manual calendar management that often causes compliance gaps to slip through unnoticed.
- Fraudulent course completion: Some platforms are now using AI to flag unusual completion patterns that may indicate a compliance risk rather than genuine learning. A cohort that completes a four-hour compliance course in twelve minutes is worth investigating before an auditor finds it first.
Conclusion
Strong LMS analytics tools do not just surface data. They change how decisions get made, how quickly compliance gaps get caught, and how confidently Strong LMS analytics do not just surface data. They change how quickly compliance gaps get caught, how confidently training teams walk into a business review, and whether learning programs earn strategic credibility or stay stuck justifying their budget every quarter. The platform behind your data determines what questions you can answer and how fast you can answer them.
Most programs outgrow basic reporting before they realize it. The signal is when your team starts spending more time building reports than reading them.
Put the right analytics in front of the right teams
Thinkific Analytics gives training teams and customer education programs revenue dashboards, enrollment reporting, funnel visibility, and completion-to-outcome tracking in one place, with no separate BI build required. For organizations managing multi-team programs, B2B client reporting, or customer education at scale, Thinkific Plus adds Advanced Analytics: fully custom dashboards for each stakeholder group, role-based access with row-level permissions, and automated report delivery via email, webhook, S3, or SFTP so every team sees what matters to them without manual exports.
Start a free Thinkific trial to explore analytics and reporting firsthand, or book a demo with the Thinkific Plus team if you’re evaluating an LMS for a larger training organization, customer education program, or B2B academy.